Investors should take notice of NASDAQ:PPC—it offers a great deal for the fundamentals it presents.
By Mill Chart
Last update: Oct 15, 2024
PILGRIM'S PRIDE CORP (NASDAQ:PPC) is a hidden gem identified by our stock screening tool, featuring undervaluation and robust fundamentals. NASDAQ:PPC showcases decent financial health and profitability, coupled with an attractive price. Let's dig deeper into the analysis.
Understanding NASDAQ:PPC's Valuation Score
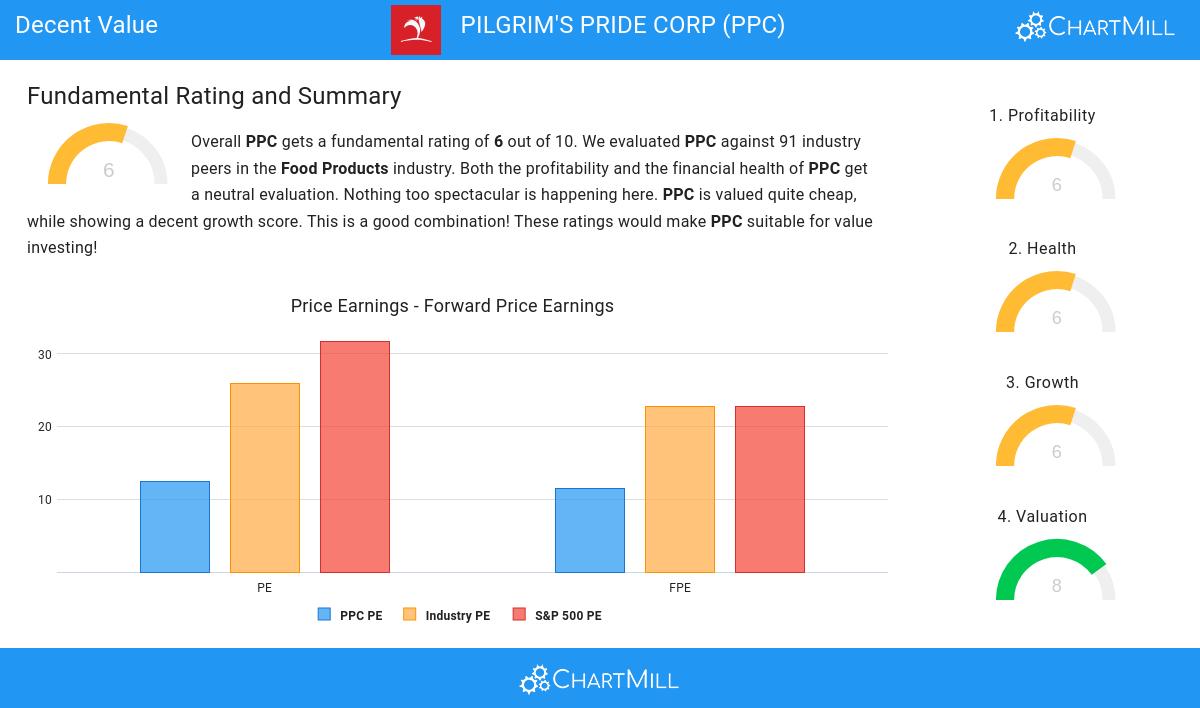
ChartMill assigns a proprietary Valuation Rating to each stock. The score is computed by evaluating various valuation aspects, like price to earnings and free cash flow, both absolutely as relative to the market and industry. NASDAQ:PPC was assigned a score of 8 for valuation:
- 81.32% of the companies in the same industry are more expensive than PPC, based on the Price/Earnings ratio.
- The average S&P500 Price/Earnings ratio is at 31.73. PPC is valued rather cheaply when compared to this.
- The Price/Forward Earnings ratio is 11.46, which indicates a very decent valuation of PPC.
- Based on the Price/Forward Earnings ratio, PPC is valued cheaper than 85.71% of the companies in the same industry.
- PPC is valuated rather cheaply when we compare the Price/Forward Earnings ratio to 22.71, which is the current average of the S&P500 Index.
- PPC's Enterprise Value to EBITDA ratio is rather cheap when compared to the industry. PPC is cheaper than 82.42% of the companies in the same industry.
- Based on the Price/Free Cash Flow ratio, PPC is valued cheaper than 81.32% of the companies in the same industry.
- PPC's low PEG Ratio(NY), which compensates the Price/Earnings for growth, indicates a rather cheap valuation of the company.
- The decent profitability rating of PPC may justify a higher PE ratio.
- PPC's earnings are expected to grow with 29.33% in the coming years. This may justify a more expensive valuation.
Profitability Insights: NASDAQ:PPC
ChartMill employs its own Profitability Rating system for stock evaluation. This score, ranging from 0 to 10, is derived from an analysis of diverse profitability metrics and margins. In the case of NASDAQ:PPC, the assigned 6 is noteworthy for profitability:
- The Return On Assets of PPC (7.51%) is better than 78.02% of its industry peers.
- With an excellent Return On Equity value of 20.28%, PPC belongs to the best of the industry, outperforming 87.91% of the companies in the same industry.
- PPC has a Return On Invested Capital of 12.08%. This is amongst the best in the industry. PPC outperforms 90.11% of its industry peers.
- The last Return On Invested Capital (12.08%) for PPC is above the 3 year average (7.82%), which is a sign of increasing profitability.
- Looking at the Profit Margin, with a value of 4.25%, PPC is in the better half of the industry, outperforming 64.84% of the companies in the same industry.
- PPC's Operating Margin of 6.40% is fine compared to the rest of the industry. PPC outperforms 63.74% of its industry peers.
Health Analysis for NASDAQ:PPC
ChartMill assigns a proprietary Health Rating to each stock. The score is computed by evaluating various liquidity and solvency ratios and ranges from 0 to 10. NASDAQ:PPC was assigned a score of 6 for health:
- PPC has an Altman-Z score of 3.75. This indicates that PPC is financially healthy and has little risk of bankruptcy at the moment.
- With a decent Altman-Z score value of 3.75, PPC is doing good in the industry, outperforming 79.12% of the companies in the same industry.
- PPC has a debt to FCF ratio of 2.87. This is a good value and a sign of high solvency as PPC would need 2.87 years to pay back of all of its debts.
- PPC has a better Debt to FCF ratio (2.87) than 76.92% of its industry peers.
- PPC's Quick ratio of 1.09 is fine compared to the rest of the industry. PPC outperforms 65.93% of its industry peers.
What does the Growth looks like for NASDAQ:PPC
Every stock receives a Growth Rating from ChartMill, ranging from 0 to 10. This rating assesses various growth aspects, including historical and projected EPS and revenue growth. NASDAQ:PPC boasts a 6 out of 10:
- PPC shows a strong growth in Earnings Per Share. In the last year, the EPS has been growing by 222.32%, which is quite impressive.
- Measured over the past years, PPC shows a quite strong growth in Revenue. The Revenue has been growing by 9.68% on average per year.
- Based on estimates for the next years, PPC will show a very strong growth in Earnings Per Share. The EPS will grow by 21.55% on average per year.
- The EPS growth rate is accelerating: in the next years the growth will be better than in the last years.
Every day, new Decent Value stocks can be found on ChartMill in our Decent Value screener.
Check the latest full fundamental report of PPC for a complete fundamental analysis.
Keep in mind
This article should in no way be interpreted as advice. The article is based on the observed metrics at the time of writing, but you should always make your own analysis and trade or invest at your own responsibility.
44.98
+0.42 (+0.94%)
Find more stocks in the Stock Screener
PPC Latest News and Analysis
 20 days ago - ChartmillPILGRIM'S PRIDE CORP (NASDAQ:PPC) – An Undervalued Stock Worth Considering
PILGRIM'S PRIDE CORP (PPC) offers strong profitability, solid financial health, and an attractive valuation, making it a potential pick for value investors. The stock trades at a low P/E ratio and boasts a high dividend yield.
