Why NASDAQ:PODD Is a Standout High-Growth Stock in a Consolidation Phase.
By Mill Chart
Last update: Feb 6, 2025
Exploring Growth Potential: INSULET CORP (NASDAQ:PODD) and Its Base Formation. Growth investors seek promising revenue and EPS growth, and INSULET CORP has come under our scrutiny for potential growth investing. While it's crucial to do your own research, we've detected INSULET CORP on our screen for growth with base formation, suggesting it merits a closer look.
Understanding NASDAQ:PODD's Growth Score
ChartMill assigns a Growth Rating to each stock, ranging from 0 to 10. This rating is determined by analyzing different growth elements, including EPS and revenue growth, spanning both historical and future figures. In the case of NASDAQ:PODD, the assigned 8 reflects its growth potential:
- The Earnings Per Share has grown by an impressive 129.49% over the past year.
- PODD shows a strong growth in Earnings Per Share. Measured over the last years, the EPS has been growing by 122.39% yearly.
- The Revenue has grown by 27.42% in the past year. This is a very strong growth!
- Measured over the past years, PODD shows a very strong growth in Revenue. The Revenue has been growing by 24.66% on average per year.
- The Earnings Per Share is expected to grow by 18.91% on average over the next years. This is quite good.
- PODD is expected to show quite a strong growth in Revenue. In the coming years, the Revenue will grow by 16.93% yearly.
Assessing Health for NASDAQ:PODD
ChartMill assigns a Health Rating to every stock. This score ranges from 0 to 10 and evaluates the different health aspects like liquidity and solvency, both absolutely, but also relative to the industry peers. NASDAQ:PODD scores a 6 out of 10:
- PODD has an Altman-Z score of 7.78. This indicates that PODD is financially healthy and has little risk of bankruptcy at the moment.
- The Altman-Z score of PODD (7.78) is better than 85.79% of its industry peers.
- PODD has a Debt to FCF ratio of 6.41. This is in the better half of the industry: PODD outperforms 75.26% of its industry peers.
- PODD has a Current Ratio of 3.68. This indicates that PODD is financially healthy and has no problem in meeting its short term obligations.
- PODD's Current ratio of 3.68 is fine compared to the rest of the industry. PODD outperforms 67.37% of its industry peers.
- A Quick Ratio of 2.80 indicates that PODD has no problem at all paying its short term obligations.
- With a decent Quick ratio value of 2.80, PODD is doing good in the industry, outperforming 61.05% of the companies in the same industry.
Exploring NASDAQ:PODD's Profitability
ChartMill employs its own Profitability Rating system for stock evaluation. This score, ranging from 0 to 10, is derived from an analysis of diverse profitability metrics and margins. In the case of NASDAQ:PODD, the assigned 8 is noteworthy for profitability:
- PODD has a better Return On Assets (13.91%) than 94.74% of its industry peers.
- PODD has a better Return On Equity (37.65%) than 98.95% of its industry peers.
- With an excellent Return On Invested Capital value of 8.69%, PODD belongs to the best of the industry, outperforming 88.42% of the companies in the same industry.
- The 3 year average ROIC (4.58%) for PODD is below the current ROIC(8.69%), indicating increased profibility in the last year.
- Looking at the Profit Margin, with a value of 21.22%, PODD belongs to the top of the industry, outperforming 93.68% of the companies in the same industry.
- PODD's Profit Margin has improved in the last couple of years.
- The Operating Margin of PODD (15.42%) is better than 85.79% of its industry peers.
- In the last couple of years the Operating Margin of PODD has grown nicely.
- PODD's Gross Margin of 69.36% is fine compared to the rest of the industry. PODD outperforms 80.00% of its industry peers.
Why is NASDAQ:PODD a setup?
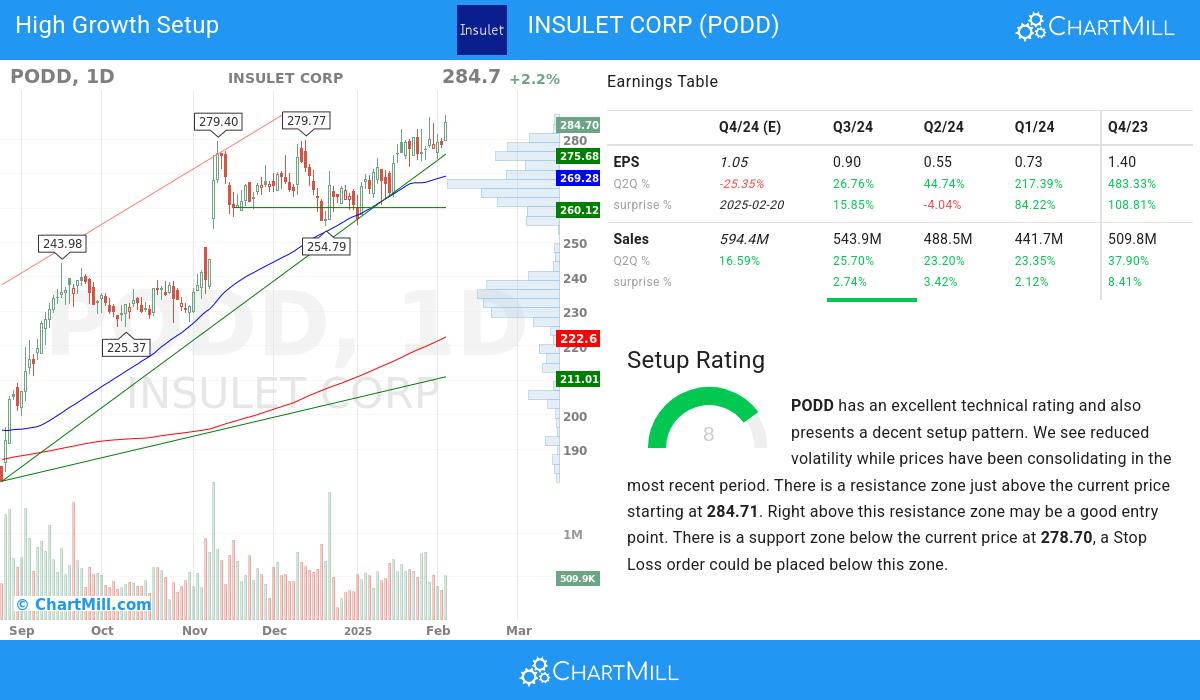
ChartMill takes into account not only the Technical Rating but also assigns a Setup Rating to each stock. This rating, on a scale of 0 to 10, reflects the degree of consolidation observed based on short-term technical indicators. Currently, NASDAQ:PODD exhibits a 8 setup rating, indicating its consolidation status in recent days and weeks.
PODD has an excellent technical rating and also presents a decent setup pattern. We see reduced volatility while prices have been consolidating in the most recent period. There is a resistance zone just above the current price starting at 284.71. Right above this resistance zone may be a good entry point. There is a support zone below the current price at 278.70, a Stop Loss order could be placed below this zone.
More Strong Growth stocks can be found in our Strong Growth screener.
For an up to date full fundamental analysis you can check the fundamental report of PODD
For an up to date full technical analysis you can check the technical report of PODD
Disclaimer
This is not investing advice! The article highlights some of the observations at the time of writing, but you should always make your own analysis and invest based on your own insights.
NASDAQ:PODD (12/12/2025, 10:51:44 AM)
296.31
+2.14 (+0.73%)
Find more stocks in the Stock Screener
PODD Latest News and Analysis