
Is NASDAQ:PLTR a Fit for high Growth Investing Strategies?
By Mill Chart
Last update: Dec 24, 2024
A possible breakout setup was detected on PALANTIR TECHNOLOGIES INC-A (NASDAQ:PLTR) by our stockscreener. A breakout pattern is formed when a stock consolidates after a strong rise up. We note that this pattern is detected purely based on technical analysis and whether the breakout actually materializes remains to be seen. It could be interesting to keep an eye on NASDAQ:PLTR.
In-Depth Technical Analysis of NASDAQ:PLTR
ChartMill assigns a Technical Rating to every stock. This score ranges from 0 to 10 and is updated daily. The score is determined by evaluating multiple technical indicators and properties.
We assign a technical rating of 10 out of 10 to PLTR. Both in the recent history as in the last year, PLTR has proven to be a steady performer, scoring decent points in every aspect analyzed.
- Both the short term and long term trends are positive. This is a very positive sign.
- Looking at the yearly performance, PLTR did better than 99% of all other stocks. We also observe that the gains produced by PLTR over the past year are nicely spread over this period.
- PLTR is one of the better performing stocks in the Software industry, it outperforms 96% of 280 stocks in the same industry.
- PLTR is currently making a new 52 week high. This is a strong signal. The S&P500 Index is trading in the upper part of its 52 week range, but not near new highs, so PLTR is leading the market.
- In the last month PLTR has a been trading in the 63.89 - 82.02 range, which is quite wide. It is currently trading near the high of this range.
- Volume is considerably higher in the last couple of days, which is what you like to see during a strong movement up.
- Prices have been rising strongly lately, it may be a good idea to wait for a consolidation or pullback before considering an entry.
Our latest full technical report of PLTR contains the most current technical analsysis.
Looking at the Setup
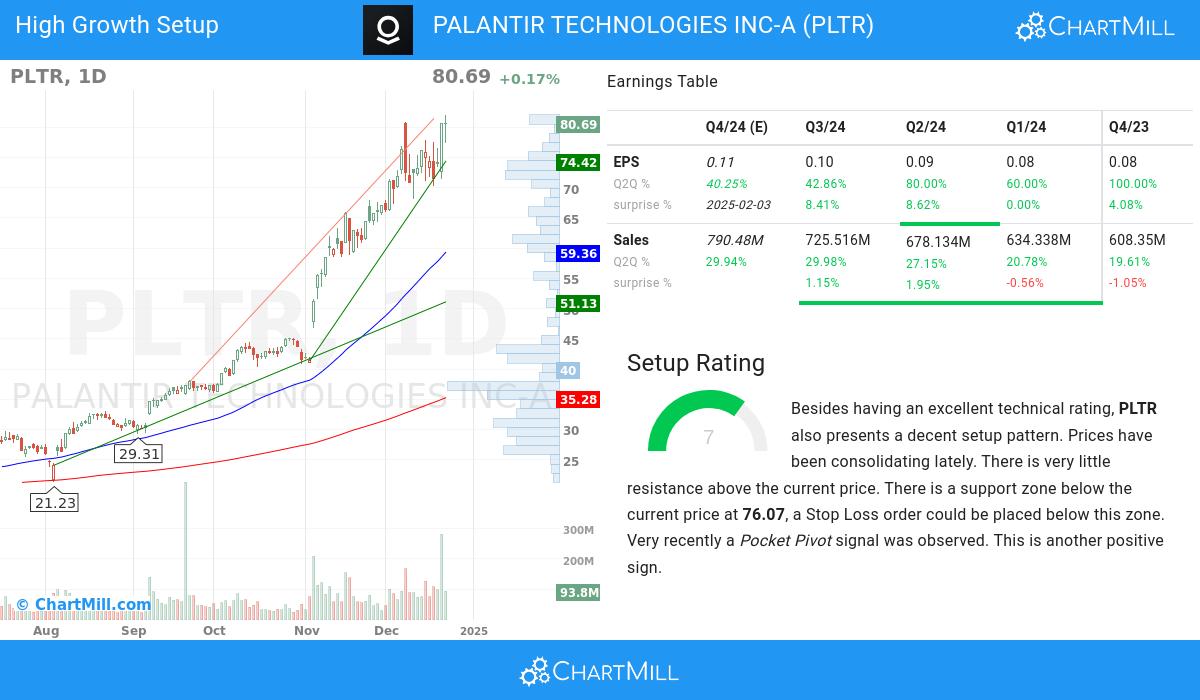
Next to the Technical Rating, the Setup Rating of a stock determines to which extend the stock is consolidating. This score also ranges from 0 to 10 and is updated daily. The setup score evaluates various short term technical indicators. For NASDAQ:PLTR this score is currently 7:
Besides having an excellent technical rating, PLTR also presents a decent setup pattern. Prices have been consolidating lately. There is very little resistance above the current price. There is a support zone below the current price at 76.07, a Stop Loss order could be placed below this zone. Another positive sign is the recent Pocket Pivot signal.
Why NASDAQ:PLTR may be interesting for high growth investors.
- With a favorable trend in its quarter-to-quarter (Q2Q) earnings per share (EPS), PALANTIR TECHNOLOGIES INC-A highlights its ability to generate increasing profitability, showcasing a 42.86% growth.
- The recent q2q revenue growth of 29.98% of PALANTIR TECHNOLOGIES INC-A showcases the company's ability to generate increasing revenue in a short period, reflecting its positive growth trajectory.
- With impressive 1-year revenue growth of 24.52%, PALANTIR TECHNOLOGIES INC-A showcases its ability to generate increased sales and revenue. This growth highlights the company's strong customer demand and its effective business strategies.
- PALANTIR TECHNOLOGIES INC-A has seen a 26.8% change in the average next Quarter EPS Estimate by analysts over the last 3 months, signaling the shifting perception of the company's EPS outlook.
- The recent financial report of PALANTIR TECHNOLOGIES INC-A demonstrates a 42.86% increase in quarterly earnings compared to the previous quarter. This growth indicates positive momentum in the company's financials and suggests a promising upward trend
- With a favorable trend in its operating margin over the past year, PALANTIR TECHNOLOGIES INC-A demonstrates its ability to enhance profitability through efficient operations. This growth reflects the company's focus on optimizing its cost structure.
- The free cash flow (FCF) of PALANTIR TECHNOLOGIES INC-A has seen steady growth over the past year, indicating enhanced cash flow generation and financial health. This trend underscores the company's effective capital management and its ability to generate sustainable cash flows.
- With a favorable Return on Equity (ROE) of 10.59%, PALANTIR TECHNOLOGIES INC-A demonstrates its ability to deliver attractive returns for shareholders. This metric highlights the company's effective management of assets and its profitability.
- With a Debt-to-Equity ratio at 0.0, PALANTIR TECHNOLOGIES INC-A showcases its prudent financial management. The company's balanced approach between debt and equity reflects its commitment to maintaining a stable capital structure.
- The ownership composition of PALANTIR TECHNOLOGIES INC-A reflects a balanced investor ecosystem, with institutional shareholders owning 44.45%. This indicates a broader market participation and potential for increased trading liquidity.
- PALANTIR TECHNOLOGIES INC-A has consistently surpassed EPS estimates in the last 4 quarters, reflecting its strong financial performance and effective management. This trend suggests the company's ability to generate positive earnings surprises and drive shareholder value.
- PALANTIR TECHNOLOGIES INC-A has achieved an impressive Relative Strength (RS) rating of 99.08, showcasing its ability to outperform the broader market. This strong performance positions PALANTIR TECHNOLOGIES INC-A as an attractive stock for potential price appreciation.
Our High Growth Momentum Breakout screen will find you more ideas suited for high growth momentum breakouts.
Disclaimer
This is not investing advice! The article highlights some of the observations at the time of writing, but you should always make your own analysis and invest based on your own insights.
NASDAQ:PLTR (2/25/2025, 3:40:10 PM)
86.885
-3.8 (-4.19%)
Find more stocks in the Stock Screener
PLTR Latest News and Analysis
 an hour ago - ChartmillWhich S&P500 stocks are moving on Tuesday?
Let's have a look at what is happening on the US markets one hour before the close of the markets on Tuesday. Below you can find the top S&P500 gainers and losers in today's session.
 2 hours ago - ChartmillCurious about the most active S&P500 stocks in today's session?
Let's have a look at what is happening on the US markets on Tuesday. Below you can find the most active S&P500 stocks in today's session.
2 hours ago - ChartmillThese stocks are the most active in today's sessionTuesday's session is buzzing with activity. Check out the stocks that are attracting the most attention and driving market activity!
 5 hours ago - ChartmillThese S&P500 stocks are gapping in today's session
Curious about the S&P500 stocks that are gapping on Tuesday? Explore the gap up and gap down stocks in the S&P500 index during today's session.
a day ago - ChartmillUncover the latest developments among S&P500 stocks in today's session.Curious about the top performers within the S&P500 index one hour before the close of the markets on Monday? Dive into the list of today's session's top gainers and losers for a comprehensive overview.
a day ago - ChartmillMost active S&P500 stocks in Monday's sessionStay informed about the most active S&P500 stocks in today's session as we take a closer look at what's happening on the US markets on Monday. Discover the stocks that are generating the highest trading volume and driving market activity.
a day ago - ChartmillThese stocks are making the most noise in today's session.Curious about the most active stocks in today's session? Get a glimpse into the stocks that are generating the highest trading volume and capturing market attention.
a day ago - ChartmillExploring the top movers within the S&P500 index during today's session.Let's have a look at what is happening on the US markets in the middle of the day on Monday. Below you can find the top S&P500 gainers and losers in today's session.
a day ago - ChartmillWhich S&P500 stocks are gapping on Monday?Looking for the S&P500 stocks that are experiencing notable gaps on Monday? Find out which stocks are gapping up and gapping down in the S&P500 index during today's session.
4 days ago - ChartmillThese S&P500 stocks are the most active in today's sessionLet's have a look at what is happening on the US markets on Friday. Below you can find the most active S&P500 stocks in today's session.
 4 days ago - ChartmillMarket Monitor February 20th
US Markets Decline as Weak Earnings and Economic Concerns Weigh on Stocks
5 days ago - ChartmillUncover the latest developments among S&P500 stocks in today's session.Stay updated with the movement of S&P500 stocks in today's session. Discover which S&P500 stocks are making waves on Thursday.
