
Why the CANSLIM investor may take a look at NASDAQ:PLMR.
By Mill Chart
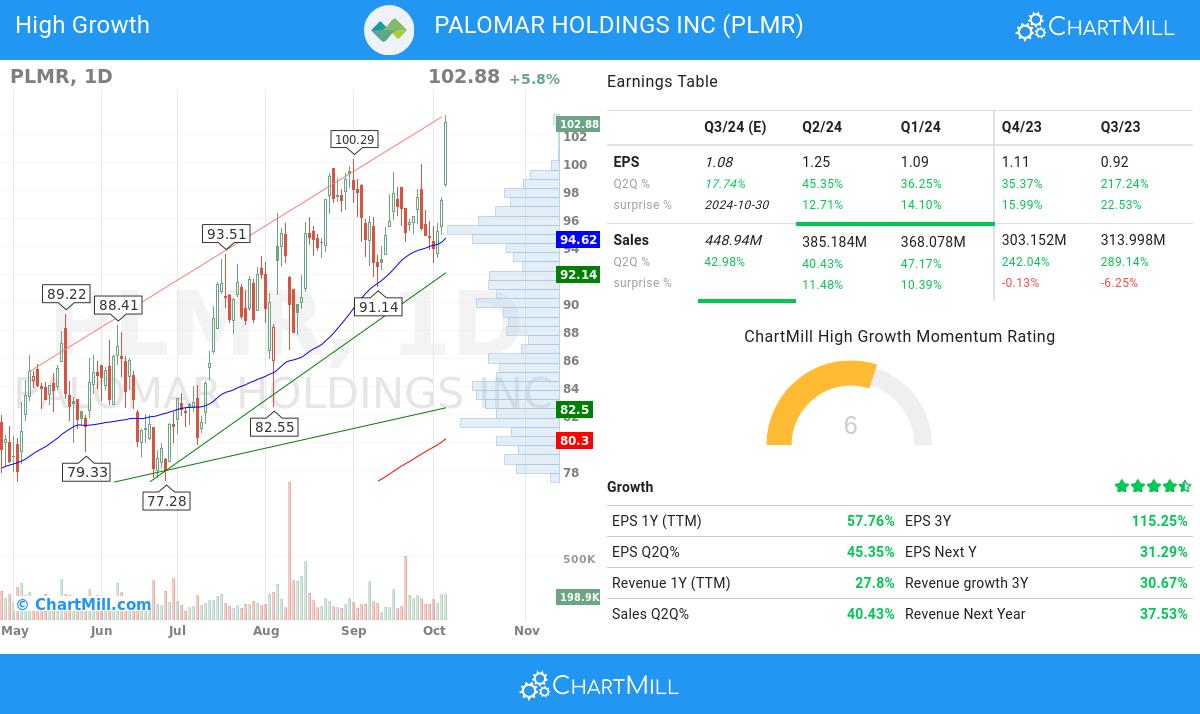
Last update: Oct 7, 2024
Groth investors are looking for stocks showing high revenue and EPS growth. We will have a look here to see if PALOMAR HOLDINGS INC (NASDAQ:PLMR) is suited for growth investing. Investors should of course do their own research, but we spotted PALOMAR HOLDINGS INC showing up in our CANSLIM growth screen, so it may be worth spending some more time on it.
What matters for canslim investors.
- The EPS of PALOMAR HOLDINGS INC has exhibited growth from one quarter to another (Q2Q), with a 45.35% increase. This underscores the company's ability to generate higher earnings and improve its financial standing.
- The recent q2q revenue growth of 40.43% of PALOMAR HOLDINGS INC showcases the company's ability to generate increasing revenue in a short period, reflecting its positive growth trajectory.
- PALOMAR HOLDINGS INC has experienced 115.0% growth in EPS over a 3-year period, demonstrating its ability to generate sustained and positive earnings momentum.
- PALOMAR HOLDINGS INC has achieved an impressive Return on Equity (ROE) of 18.11%, showcasing its ability to generate favorable returns for shareholders.
- The Relative Strength (RS) of PALOMAR HOLDINGS INC has been consistently solid, with a current 95.39 rating. This highlights the stock's ability to exhibit sustained price strength and signifies its competitive advantage. PALOMAR HOLDINGS INC exhibits strong prospects for further price appreciation.
- PALOMAR HOLDINGS INC exhibits a favorable Debt-to-Equity ratio at 0.0. This highlights the company's ability to limit excessive debt levels and maintain a strong equity base, demonstrating its financial stability and risk management practices.
- PALOMAR HOLDINGS INC demonstrates a balanced ownership structure, with institutional shareholders at 84.99%. This indicates a diverse investor base, which can contribute to price stability and potential future growth.
Insights from Technical Analysis
ChartMill utilizes a proprietary algorithm to assign a Technical Rating to every stock. This rating, ranging from 0 to 10, is computed daily by analyzing a variety of technical indicators and properties.
Overall PLMR gets a technical rating of 10 out of 10. Both in the recent history as in the last year, PLMR has proven to be a steady performer, scoring decent points in every aspect analyzed.
- The long and short term trends are both positive. This is looking good!
- Looking at the yearly performance, PLMR did better than 95% of all other stocks. On top of that, PLMR also shows a nice and consistent pattern of rising prices.
- PLMR is one of the better performing stocks in the Insurance industry, it outperforms 95% of 141 stocks in the same industry.
- A new 52 week high is currently being made by PLMR, which is a very good signal! However, this is in line with the S&P500, which is also trading near new highs.
- In the last month PLMR has a been trading in the 91.14 - 103.40 range, which is quite wide. It is currently trading near the high of this range.
- Prices have been rising strongly lately, it may be a good idea to wait for a consolidation or pullback before considering an entry.
For an up to date full technical analysis you can check the technical report of PLMR
Zooming in on the fundamentals.
At ChartMill, a crucial aspect of their analysis is the assignment of a Fundamental Rating to each stock. This rating, ranging from 0 to 10, is calculated daily by considering numerous fundamental indicators and properties.
We assign a fundamental rating of 6 out of 10 to PLMR. PLMR was compared to 141 industry peers in the Insurance industry. While PLMR has a great profitability rating, there are some minor concerns on its financial health. PLMR is growing strongly while it is still valued neutral. This is a good combination!
Check the latest full fundamental report of PLMR for a complete fundamental analysis.
More ideas for growth investing can be found on ChartMill in our CANSLIM screen.
Disclaimer
This article should in no way be interpreted as advice. The article is based on the observed metrics at the time of writing, but you should always make your own analysis and trade or invest at your own responsibility.
