In the world of growth stocks, PINTEREST INC- CLASS A (NYSE:PINS) shines as a value proposition.
By Mill Chart
Last update: Mar 31, 2025
PINTEREST INC- CLASS A (NYSE:PINS) has caught the eye of our stock screener as an affordable growth stock. PINS is displaying robust growth metrics and also excels in terms of profitability, solvency, and liquidity. Additionally, it appears to be reasonably priced. Let's delve into the details.
Evaluating Growth: PINS
ChartMill assigns a Growth Rating to every stock. This score ranges from 0 to 10 and evaluates the different growth aspects like EPS and Revenue, both in the past as in the future. PINS scores a 8 out of 10:
- The Earnings Per Share has grown by an impressive 31.82% over the past year.
- PINS shows quite a strong growth in Earnings Per Share. Measured over the last years, the EPS has been growing by 8.67% yearly.
- Looking at the last year, PINS shows a quite strong growth in Revenue. The Revenue has grown by 19.35% in the last year.
- Measured over the past years, PINS shows a very strong growth in Revenue. The Revenue has been growing by 26.12% on average per year.
- PINS is expected to show quite a strong growth in Earnings Per Share. In the coming years, the EPS will grow by 18.63% yearly.
- PINS is expected to show quite a strong growth in Revenue. In the coming years, the Revenue will grow by 14.25% yearly.
- The EPS growth rate is accelerating: in the next years the growth will be better than in the last years.
Unpacking PINS's Valuation Rating
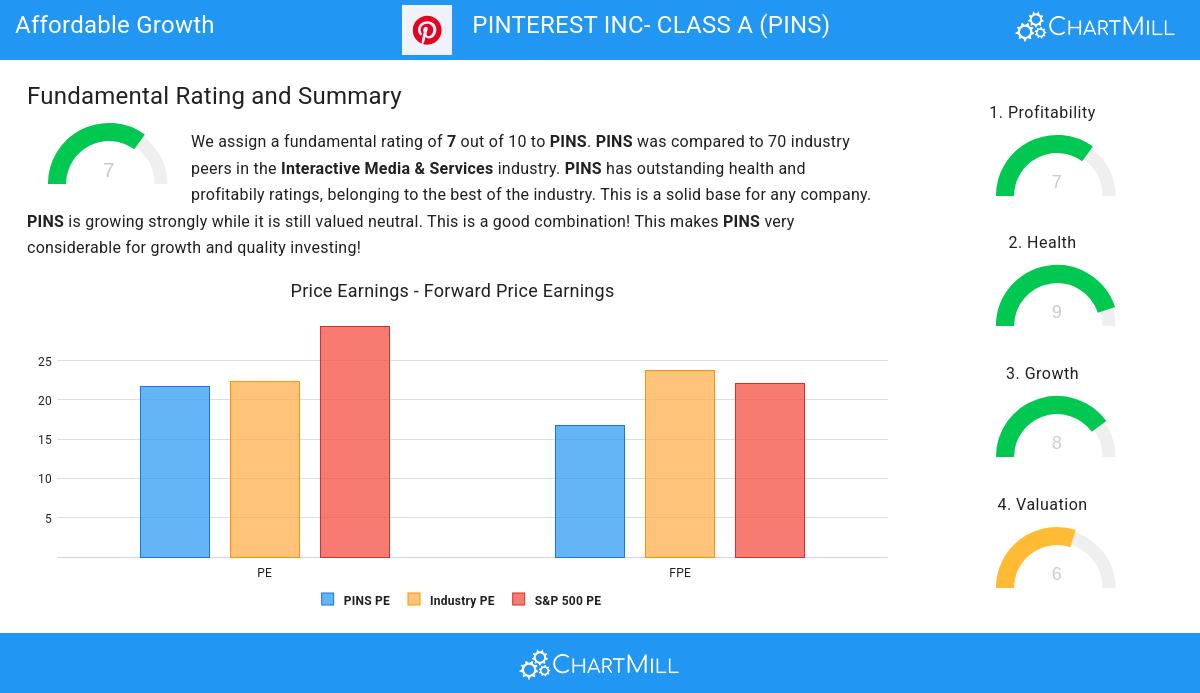
ChartMill assigns a Valuation Rating to every stock. This score ranges from 0 to 10 and evaluates the different valuation aspects and compares the price to earnings and cash flows, while taking into account profitability and growth. PINS scores a 6 out of 10:
- 68.57% of the companies in the same industry are more expensive than PINS, based on the Price/Earnings ratio.
- The average S&P500 Price/Earnings ratio is at 29.40. PINS is valued slightly cheaper when compared to this.
- Compared to the rest of the industry, the Price/Forward Earnings ratio of PINS indicates a somewhat cheap valuation: PINS is cheaper than 65.71% of the companies listed in the same industry.
- PINS's Price/Forward Earnings ratio indicates a valuation a bit cheaper than the S&P500 average which is at 22.15.
- Based on the Price/Free Cash Flow ratio, PINS is valued a bit cheaper than the industry average as 68.57% of the companies are valued more expensively.
- PINS's low PEG Ratio(NY), which compensates the Price/Earnings for growth, indicates a rather cheap valuation of the company.
- PINS has a very decent profitability rating, which may justify a higher PE ratio.
- PINS's earnings are expected to grow with 23.07% in the coming years. This may justify a more expensive valuation.
Understanding PINS's Health Score
ChartMill assigns a proprietary Health Rating to each stock. The score is computed by evaluating various liquidity and solvency ratios and ranges from 0 to 10. PINS was assigned a score of 9 for health:
- An Altman-Z score of 23.06 indicates that PINS is not in any danger for bankruptcy at the moment.
- The Altman-Z score of PINS (23.06) is better than 95.71% of its industry peers.
- PINS has no outstanding debt. Therefor its Debt/Equity and Debt/FCF ratios are 0 and belong to the best of the industry.
- A Current Ratio of 8.75 indicates that PINS has no problem at all paying its short term obligations.
- Looking at the Current ratio, with a value of 8.75, PINS belongs to the top of the industry, outperforming 95.71% of the companies in the same industry.
- PINS has a Quick Ratio of 8.75. This indicates that PINS is financially healthy and has no problem in meeting its short term obligations.
- The Quick ratio of PINS (8.75) is better than 95.71% of its industry peers.
Looking at the Profitability
ChartMill assigns a Profitability Rating to every stock. This score ranges from 0 to 10 and evaluates the different profitability ratios and margins, both absolutely, but also relative to the industry peers. PINS scores a 7 out of 10:
- PINS has a better Return On Assets (34.85%) than 100.00% of its industry peers.
- PINS has a better Return On Equity (39.19%) than 98.57% of its industry peers.
- With a decent Return On Invested Capital value of 2.87%, PINS is doing good in the industry, outperforming 67.14% of the companies in the same industry.
- PINS has a Profit Margin of 51.07%. This is amongst the best in the industry. PINS outperforms 98.57% of its industry peers.
- In the last couple of years the Profit Margin of PINS has grown nicely.
- PINS has a better Operating Margin (4.93%) than 64.29% of its industry peers.
- Looking at the Gross Margin, with a value of 79.42%, PINS is in the better half of the industry, outperforming 71.43% of the companies in the same industry.
- In the last couple of years the Gross Margin of PINS has grown nicely.
Our Affordable Growth screener lists more Affordable Growth stocks and is updated daily.
For an up to date full fundamental analysis you can check the fundamental report of PINS
Disclaimer
This article should in no way be interpreted as advice. The article is based on the observed metrics at the time of writing, but you should always make your own analysis and trade or invest at your own responsibility.
NYSE:PINS (4/24/2025, 2:47:09 PM)
25.82
+0.21 (+0.82%)
Find more stocks in the Stock Screener
PINS Latest News and Analysis
 3 days ago - ChartmillWhile growth is established for PINTEREST INC- CLASS A (NYSE:PINS), the stock's valuation remains reasonable.
PINTEREST INC- CLASS A was identified as a growth stock that isn't overvalued. NYSE:PINS is excelling in various growth indicators while maintaining a solid financial footing.
