
PINTEREST INC- CLASS A (NYSE:PINS) has caught the eye of our stock screener as an affordable growth stock. NYSE:PINS is displaying robust growth metrics and also excels in terms of profitability, solvency, and liquidity. Additionally, it appears to be reasonably priced. Let's delve into the details.
Unpacking NYSE:PINS's Growth Rating
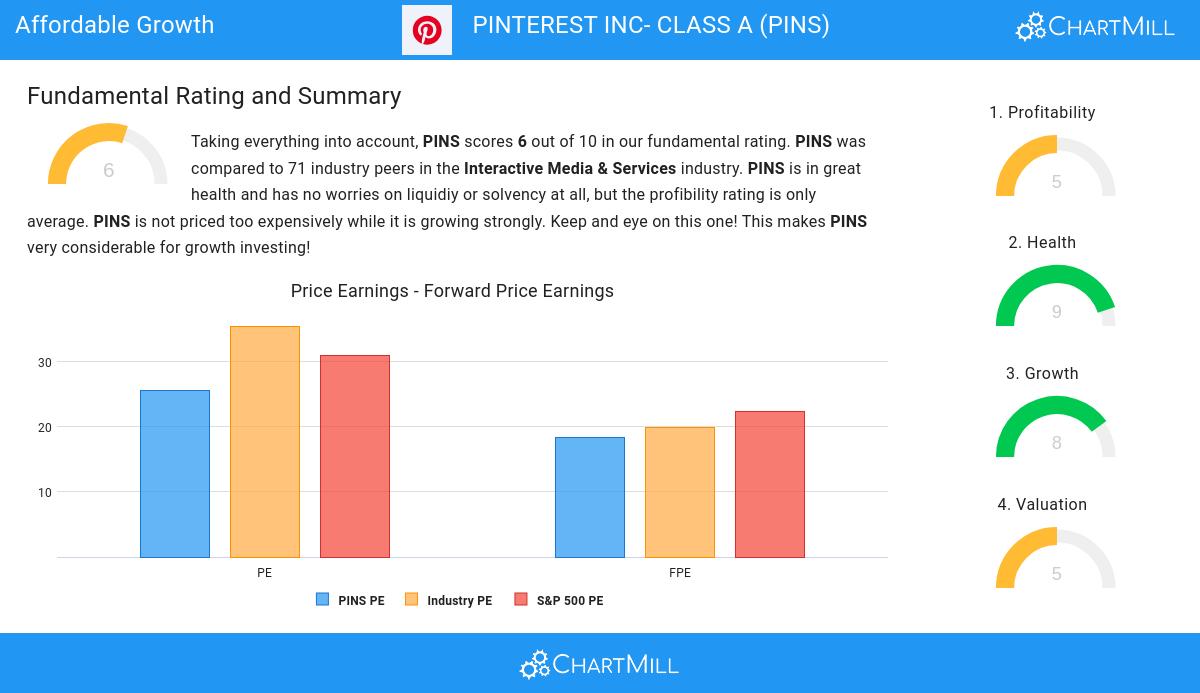
To evaluate a stock's growth potential, ChartMill utilizes a Growth Rating on a scale of 0 to 10. This comprehensive assessment considers various growth aspects, including historical and estimated EPS and revenue growth. NYSE:PINS has achieved a 8 out of 10:
- PINS shows a strong growth in Earnings Per Share. In the last year, the EPS has been growing by 88.41%, which is quite impressive.
- The Earnings Per Share has been growing by 41.29% on average over the past years. This is a very strong growth
- Looking at the last year, PINS shows a quite strong growth in Revenue. The Revenue has grown by 16.21% in the last year.
- PINS shows a strong growth in Revenue. Measured over the last years, the Revenue has been growing by 32.22% yearly.
- The Earnings Per Share is expected to grow by 19.43% on average over the next years. This is quite good.
- Based on estimates for the next years, PINS will show a quite strong growth in Revenue. The Revenue will grow by 15.56% on average per year.
Evaluating Valuation: NYSE:PINS
To assess a stock's valuation, ChartMill utilizes a Valuation Rating on a scale of 0 to 10. This comprehensive assessment considers various valuation aspects, comparing price to earnings and cash flows, while factoring in profitability and growth. NYSE:PINS has achieved a 5 out of 10:
- Based on the Price/Earnings ratio, PINS is valued a bit cheaper than the industry average as 65.71% of the companies are valued more expensively.
- Compared to the rest of the industry, the Price/Forward Earnings ratio of PINS indicates a somewhat cheap valuation: PINS is cheaper than 71.43% of the companies listed in the same industry.
- 70.00% of the companies in the same industry are more expensive than PINS, based on the Price/Free Cash Flow ratio.
- PINS's low PEG Ratio(NY), which compensates the Price/Earnings for growth, indicates a rather cheap valuation of the company.
- PINS's earnings are expected to grow with 26.51% in the coming years. This may justify a more expensive valuation.
Evaluating Health: NYSE:PINS
To gauge a stock's financial health, ChartMill utilizes a Health Rating on a scale of 0 to 10. This comprehensive evaluation encompasses liquidity and solvency, both in absolute terms and in comparison to industry peers. NYSE:PINS has earned a 9 out of 10:
- An Altman-Z score of 26.10 indicates that PINS is not in any danger for bankruptcy at the moment.
- Looking at the Altman-Z score, with a value of 26.10, PINS belongs to the top of the industry, outperforming 98.57% of the companies in the same industry.
- PINS has no outstanding debt. Therefor its Debt/Equity and Debt/FCF ratios are 0 and belong to the best of the industry.
- A Current Ratio of 9.50 indicates that PINS has no problem at all paying its short term obligations.
- PINS has a Current ratio of 9.50. This is amongst the best in the industry. PINS outperforms 95.71% of its industry peers.
- A Quick Ratio of 9.50 indicates that PINS has no problem at all paying its short term obligations.
- PINS has a better Quick ratio (9.50) than 95.71% of its industry peers.
Analyzing Profitability Metrics
ChartMill assigns a proprietary Profitability Rating to each stock. The score is computed by evaluating various profitability ratios and margins and ranges from 0 to 10. NYSE:PINS was assigned a score of 5 for profitability:
- PINS has a Return On Assets of 5.12%. This is amongst the best in the industry. PINS outperforms 81.43% of its industry peers.
- PINS's Return On Equity of 6.00% is fine compared to the rest of the industry. PINS outperforms 77.14% of its industry peers.
- With a decent Return On Invested Capital value of 2.70%, PINS is doing good in the industry, outperforming 67.14% of the companies in the same industry.
- PINS's Profit Margin of 5.75% is fine compared to the rest of the industry. PINS outperforms 75.71% of its industry peers.
- Looking at the Operating Margin, with a value of 3.46%, PINS is in the better half of the industry, outperforming 65.71% of the companies in the same industry.
- The Gross Margin of PINS (78.58%) is better than 68.57% of its industry peers.
- PINS's Gross Margin has improved in the last couple of years.
Our Affordable Growth screener lists more Affordable Growth stocks and is updated daily.
Our latest full fundamental report of PINS contains the most current fundamental analsysis.
Disclaimer
This article should in no way be interpreted as advice. The article is based on the observed metrics at the time of writing, but you should always make your own analysis and trade or invest at your own responsibility.