
Discover PULTEGROUP INC (NYSE:PHM), an undervalued stock highlighted by our stock screener. NYSE:PHM showcases solid financial health and profitability while maintaining an appealing valuation. We'll explore the details.
Evaluating Valuation: NYSE:PHM
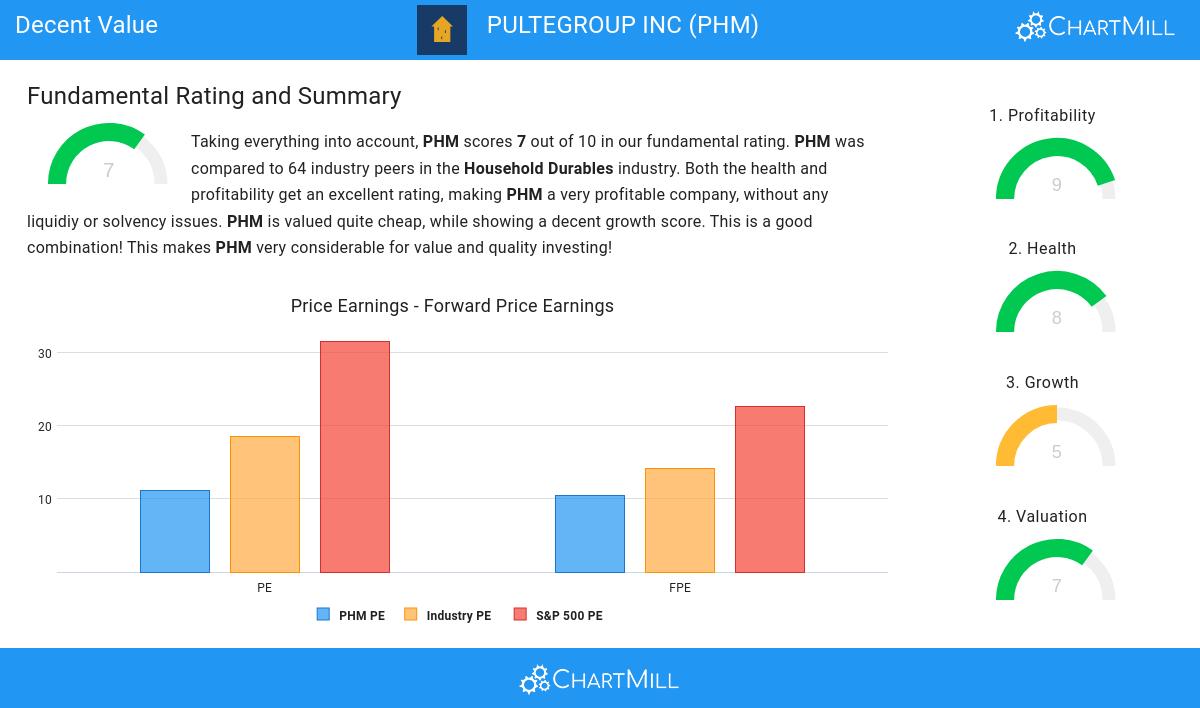
An integral part of ChartMill's stock analysis is the Valuation Rating, which spans from 0 to 10. This rating evaluates diverse valuation factors, including price to earnings and cash flows, while considering the stock's profitability and growth. NYSE:PHM has received a 7 out of 10:
- PHM is valuated reasonably with a Price/Earnings ratio of 11.19.
- Based on the Price/Earnings ratio, PHM is valued a bit cheaper than the industry average as 72.58% of the companies are valued more expensively.
- The average S&P500 Price/Earnings ratio is at 31.61. PHM is valued rather cheaply when compared to this.
- Based on the Price/Forward Earnings ratio of 10.47, the valuation of PHM can be described as reasonable.
- Compared to the rest of the industry, the Price/Forward Earnings ratio of PHM indicates a somewhat cheap valuation: PHM is cheaper than 69.35% of the companies listed in the same industry.
- The average S&P500 Price/Forward Earnings ratio is at 22.63. PHM is valued rather cheaply when compared to this.
- Based on the Enterprise Value to EBITDA ratio, PHM is valued a bit cheaper than the industry average as 79.03% of the companies are valued more expensively.
- The low PEG Ratio(NY), which compensates the Price/Earnings for growth, indicates a rather cheap valuation of the company.
- The excellent profitability rating of PHM may justify a higher PE ratio.
Analyzing Profitability Metrics
ChartMill assigns a proprietary Profitability Rating to each stock. The score is computed by evaluating various profitability ratios and margins and ranges from 0 to 10. NYSE:PHM was assigned a score of 9 for profitability:
- Looking at the Return On Assets, with a value of 17.03%, PHM belongs to the top of the industry, outperforming 96.77% of the companies in the same industry.
- Looking at the Return On Equity, with a value of 25.10%, PHM belongs to the top of the industry, outperforming 85.48% of the companies in the same industry.
- With an excellent Return On Invested Capital value of 19.91%, PHM belongs to the best of the industry, outperforming 96.77% of the companies in the same industry.
- The Average Return On Invested Capital over the past 3 years for PHM is significantly above the industry average of 10.85%.
- The last Return On Invested Capital (19.91%) for PHM is above the 3 year average (18.34%), which is a sign of increasing profitability.
- The Profit Margin of PHM (16.72%) is better than 93.55% of its industry peers.
- PHM's Profit Margin has improved in the last couple of years.
- With an excellent Operating Margin value of 21.49%, PHM belongs to the best of the industry, outperforming 95.16% of the companies in the same industry.
- In the last couple of years the Operating Margin of PHM has grown nicely.
- PHM's Gross Margin has improved in the last couple of years.
Health Analysis for NYSE:PHM
To gauge a stock's financial health, ChartMill utilizes a Health Rating on a scale of 0 to 10. This comprehensive evaluation encompasses liquidity and solvency, both in absolute terms and in comparison to industry peers. NYSE:PHM has earned a 8 out of 10:
- PHM has an Altman-Z score of 6.54. This indicates that PHM is financially healthy and has little risk of bankruptcy at the moment.
- The Altman-Z score of PHM (6.54) is better than 85.48% of its industry peers.
- The Debt to FCF ratio of PHM is 1.67, which is an excellent value as it means it would take PHM, only 1.67 years of fcf income to pay off all of its debts.
- PHM has a better Debt to FCF ratio (1.67) than 74.19% of its industry peers.
- PHM has a Debt/Equity ratio of 0.19. This is a healthy value indicating a solid balance between debt and equity.
- PHM has a Debt to Equity ratio of 0.19. This is in the better half of the industry: PHM outperforms 67.74% of its industry peers.
- A Current Ratio of 4.16 indicates that PHM has no problem at all paying its short term obligations.
- Looking at the Current ratio, with a value of 4.16, PHM is in the better half of the industry, outperforming 69.35% of the companies in the same industry.
- The current and quick ratio evaluation for PHM is rather negative, while it does have excellent solvency and profitability. These ratios do not necessarly indicate liquidity issues and need to be evaluated against the specifics of the business.
Evaluating Growth: NYSE:PHM
ChartMill assigns a Growth Rating to each stock, ranging from 0 to 10. This rating is determined by analyzing different growth elements, including EPS and revenue growth, spanning both historical and future figures. In the case of NYSE:PHM, the assigned 5 reflects its growth potential:
- The Earnings Per Share has grown by an nice 10.71% over the past year.
- Measured over the past years, PHM shows a very strong growth in Earnings Per Share. The EPS has been growing by 25.08% on average per year.
- Measured over the past years, PHM shows a quite strong growth in Revenue. The Revenue has been growing by 9.53% on average per year.
- The Earnings Per Share is expected to grow by 8.43% on average over the next years. This is quite good.
More Decent Value stocks can be found in our Decent Value screener.
For an up to date full fundamental analysis you can check the fundamental report of PHM
Keep in mind
This is not investing advice! The article highlights some of the observations at the time of writing, but you should always make your own analysis and invest based on your own insights.