
NASDAQ:PCTY, a strong growth stock, setting up for a breakout.
By Mill Chart
Last update: Sep 12, 2024
In this article, we'll take a closer look at PAYLOCITY HOLDING CORP (NASDAQ:PCTY) as a potential candidate for growth investing. While it's important for investors to conduct their own research, PAYLOCITY HOLDING CORP has piqued our interest by appearing on our strong growth and breakout radar. Let's explore further.
Growth Assessment of NASDAQ:PCTY
ChartMill employs its own Growth Rating system for all stocks. This score, ranging from 0 to 10, is derived by evaluating different growth factors, such as EPS and revenue growth, taking into account both past performance and future projections. NASDAQ:PCTY has earned a 8 for growth:
- PCTY shows a strong growth in Earnings Per Share. In the last year, the EPS has been growing by 27.52%, which is quite impressive.
- The Earnings Per Share has been growing by 36.87% on average over the past years. This is a very strong growth
- PCTY shows quite a strong growth in Revenue. In the last year, the Revenue has grown by 19.39%.
- The Revenue has been growing by 24.57% on average over the past years. This is a very strong growth!
- PCTY is expected to show quite a strong growth in Earnings Per Share. In the coming years, the EPS will grow by 10.71% yearly.
- PCTY is expected to show quite a strong growth in Revenue. In the coming years, the Revenue will grow by 13.77% yearly.
Evaluating Health: NASDAQ:PCTY
A critical element of ChartMill's stock evaluation is the Health Rating, which spans from 0 to 10. This rating considers multiple health factors, including liquidity and solvency, both in absolute terms and relative to industry peers. NASDAQ:PCTY has received a 7 out of 10:
- PCTY has no outstanding debt. Therefor its Debt/Equity and Debt/FCF ratios are 0 and belong to the best of the industry.
- The current and quick ratio evaluation for PCTY is rather negative, while it does have excellent solvency and profitability. These ratios do not necessarly indicate liquidity issues and need to be evaluated against the specifics of the business.
Analyzing Profitability Metrics
ChartMill's Profitability Rating offers a unique perspective on stock analysis, providing scores from 0 to 10. These ratings consider a wide range of profitability metrics and margins, both in comparison to industry peers and on their own merits. For NASDAQ:PCTY, the assigned 8 is a significant indicator of profitability:
- PCTY has a better Return On Assets (4.87%) than 62.50% of its industry peers.
- PCTY has a Return On Equity of 20.01%. This is in the better half of the industry: PCTY outperforms 72.50% of its industry peers.
- Looking at the Return On Invested Capital, with a value of 18.84%, PCTY belongs to the top of the industry, outperforming 83.75% of the companies in the same industry.
- The last Return On Invested Capital (18.84%) for PCTY is above the 3 year average (14.31%), which is a sign of increasing profitability.
- The Profit Margin of PCTY (14.74%) is better than 88.75% of its industry peers.
- In the last couple of years the Profit Margin of PCTY has grown nicely.
- The Operating Margin of PCTY (18.55%) is better than 86.25% of its industry peers.
- In the last couple of years the Operating Margin of PCTY has grown nicely.
- The Gross Margin of PCTY (68.50%) is better than 81.25% of its industry peers.
Looking at the Setup
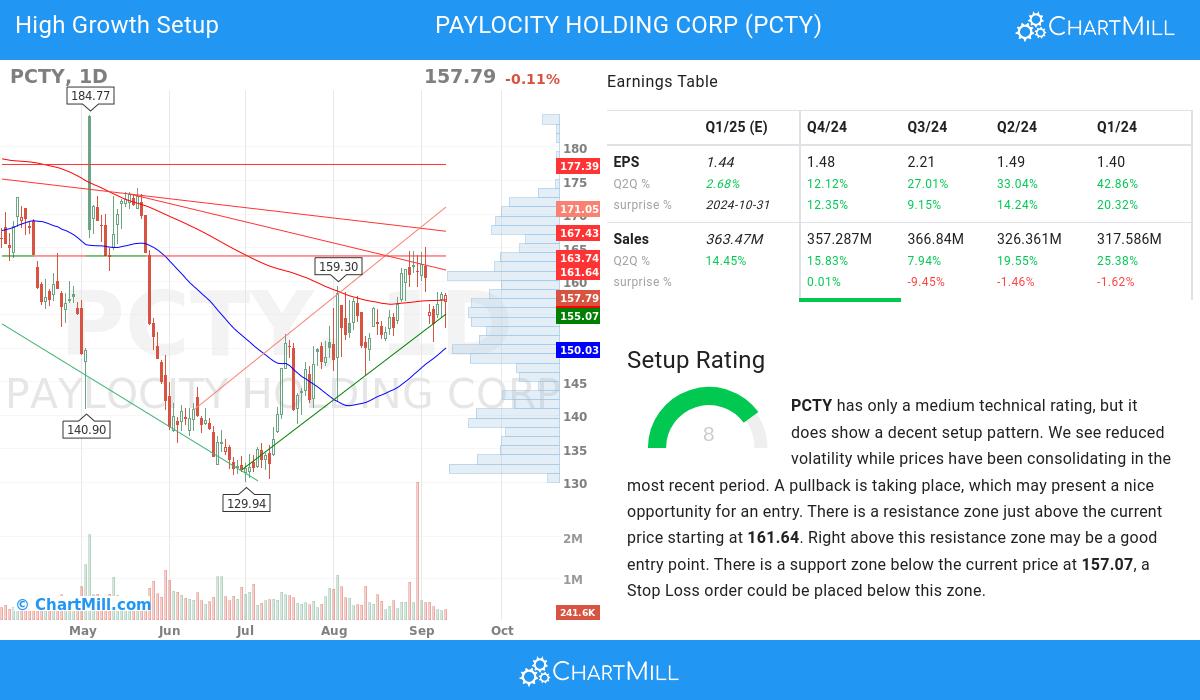
ChartMill takes into account not only the Technical Rating but also assigns a Setup Rating to each stock. This rating, on a scale of 0 to 10, reflects the degree of consolidation observed based on short-term technical indicators. Currently, NASDAQ:PCTY exhibits a 8 setup rating, indicating its consolidation status in recent days and weeks.
Although the technical rating is only medium, PCTY does present a nice setup opportunity. We see reduced volatility while prices have been consolidating in the most recent period. A pullback is taking place, which may present a nice opportunity for an entry. There is a resistance zone just above the current price starting at 161.64. Right above this resistance zone may be a good entry point. There is a support zone below the current price at 157.07, a Stop Loss order could be placed below this zone.
More Strong Growth stocks can be found in our Strong Growth screener.
Check the latest full fundamental report of PCTY for a complete fundamental analysis.
Our latest full technical report of PCTY contains the most current technical analsysis.
Keep in mind
This article should in no way be interpreted as advice. The article is based on the observed metrics at the time of writing, but you should always make your own analysis and trade or invest at your own responsibility.