
Indications Suggest NASDAQ:PAYX Could Be on the Verge of a Breakout.
By Mill Chart
Last update: Feb 21, 2025
Our stock screener has flagged PAYCHEX INC (NASDAQ:PAYX) as a potential breakout candidate. This occurs when the stock shows signs of consolidation after a notable upward trend. While we can't predict the actual breakout, it's worth monitoring NASDAQ:PAYX for potential movement.
Technical Analysis Observations
ChartMill assigns a Technical Rating to every stock. This score, ranging from 0 to 10, is updated daily and is determined by evaluating multiple technical indicators and properties.
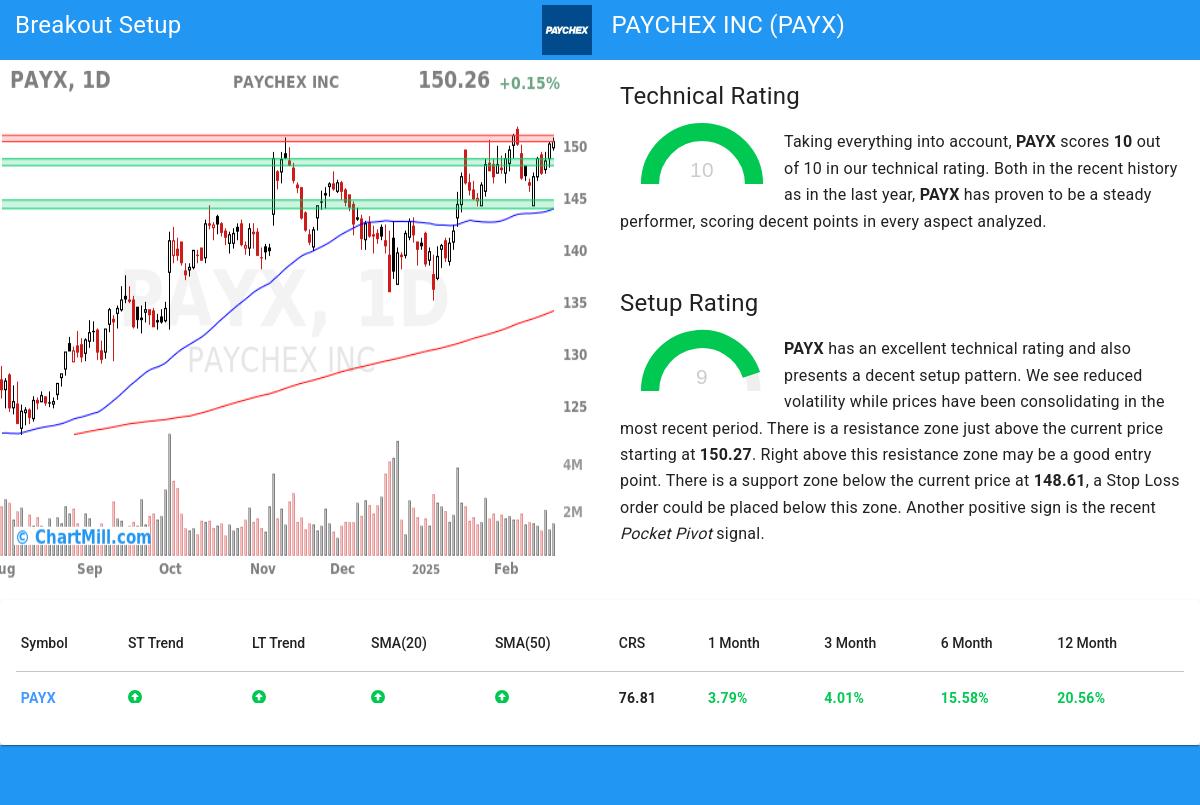
Taking everything into account, PAYX scores 10 out of 10 in our technical rating. Both in the recent history as in the last year, PAYX has proven to be a steady performer, scoring decent points in every aspect analyzed.
- The long and short term trends are both positive. This is looking good!
- When comparing the yearly performance of all stocks, we notice that PAYX is one of the better performing stocks in the market, outperforming 76% of all stocks. We also observe that the gains produced by PAYX over the past year are nicely spread over this period.
- PAYX is one of the better performing stocks in the Professional Services industry, it outperforms 82% of 82 stocks in the same industry.
- PAYX is currently trading near its 52 week high, which is a good sign. The S&P500 Index however is also trading near new highs, which makes the performance in line with the market.
- In the last month PAYX has a been trading in a tight range between 144.07 and 151.72.
For an up to date full technical analysis you can check the technical report of PAYX
Looking at the Setup
Next to the Technical Rating, the Setup Rating of a stock determines to which extend the stock is consolidating. This score also ranges from 0 to 10 and is updated daily. The setup score evaluates various short term technical indicators. For NASDAQ:PAYX this score is currently 9:
Besides having an excellent technical rating, PAYX also presents a decent setup pattern. Prices have been consolidating lately and the volatility has been reduced. There is a resistance zone just above the current price starting at 150.27. Right above this resistance zone may be a good entry point. There is a support zone below the current price at 148.61, a Stop Loss order could be placed below this zone. Another positive sign is the recent Pocket Pivot signal.
How to trade NASDAQ:PAYX?
A breakout opportunity may arise when the stock surpasses the current consolidation zone and reaches new highs. Traders often wait for this breakout before considering buying the stock. To manage risk, a stop loss order could be placed below the consolidation zone to limit potential losses.
This article should in no way be interpreted as trading advice. You should always make your own analysis and trade or not trade based on your own observations and style. The article is based purely on some technical observations.
Every day, new breakout setups can be found on ChartMill in our Breakout screener.
Disclaimer
This is not investing advice! The article highlights some of the observations at the time of writing, but you should always make your own analysis and invest based on your own insights.
144.9
-0.67 (-0.46%)
Find more stocks in the Stock Screener
PAYX Latest News and Analysis
 a day ago - ChartmillShould Quality Investors Include PAYCHEX INC (NASDAQ:PAYX) in Their Portfolio?
A fundamental analysis of (NASDAQ:PAYX): PAYCHEX INC (NASDAQ:PAYX) can be considered a quality stock. Here's why.
