
NYSE:PAYC—Positioned as a High-Growth Stock, Ready for a Potential Breakout.
By Mill Chart
Last update: Oct 11, 2024
In this article we will dive into PAYCOM SOFTWARE INC (NYSE:PAYC) as a possible candidate for growth investing. Investors should always do their own research, but we noticed PAYCOM SOFTWARE INC showing up in our strong growth, ready to breakout screen, which makes it worth to investigate a bit more.
Assessing Growth Metrics for NYSE:PAYC
To evaluate a stock's growth potential, ChartMill utilizes a Growth Rating on a scale of 0 to 10. This comprehensive assessment considers various growth aspects, including historical and estimated EPS and revenue growth. NYSE:PAYC has achieved a 8 out of 10:
- PAYC shows a strong growth in Earnings Per Share. In the last year, the EPS has been growing by 11.72%, which is quite good.
- The Earnings Per Share has been growing by 23.85% on average over the past years. This is a very strong growth
- The Revenue has grown by 14.18% in the past year. This is quite good.
- The Revenue has been growing by 24.50% on average over the past years. This is a very strong growth!
- Based on estimates for the next years, PAYC will show a quite strong growth in Earnings Per Share. The EPS will grow by 12.10% on average per year.
- Based on estimates for the next years, PAYC will show a quite strong growth in Revenue. The Revenue will grow by 11.79% on average per year.
What does the Health looks like for NYSE:PAYC
ChartMill utilizes a Health Rating to assess stocks, scoring them on a scale of 0 to 10. This rating takes into account a variety of liquidity and solvency ratios, both in absolute terms and in comparison to industry peers. NYSE:PAYC has earned a 8 out of 10:
- PAYC has an Altman-Z score of 3.52. This indicates that PAYC is financially healthy and has little risk of bankruptcy at the moment.
- Looking at the Altman-Z score, with a value of 3.52, PAYC is in the better half of the industry, outperforming 63.75% of the companies in the same industry.
- PAYC has no outstanding debt. Therefor its Debt/Equity and Debt/FCF ratios are 0 and belong to the best of the industry.
- The current and quick ratio evaluation for PAYC is rather negative, while it does have excellent solvency and profitability. These ratios do not necessarly indicate liquidity issues and need to be evaluated against the specifics of the business.
A Closer Look at Profitability for NYSE:PAYC
Discover ChartMill's exclusive Profitability Rating, a proprietary metric that assesses stocks on a scale of 0 to 10. It takes into consideration various profitability ratios and margins, both in absolute terms and relative to industry peers. Notably, NYSE:PAYC has achieved a 8:
- The Return On Assets of PAYC (10.95%) is better than 86.25% of its industry peers.
- PAYC has a Return On Equity of 33.10%. This is amongst the best in the industry. PAYC outperforms 86.25% of its industry peers.
- PAYC has a Return On Invested Capital of 23.63%. This is amongst the best in the industry. PAYC outperforms 91.25% of its industry peers.
- PAYC had an Average Return On Invested Capital over the past 3 years of 17.49%. This is above the industry average of 12.67%.
- The last Return On Invested Capital (23.63%) for PAYC is above the 3 year average (17.49%), which is a sign of increasing profitability.
- PAYC has a better Profit Margin (26.55%) than 95.00% of its industry peers.
- PAYC's Operating Margin of 32.87% is amongst the best of the industry. PAYC outperforms 96.25% of its industry peers.
- PAYC has a Gross Margin of 82.79%. This is amongst the best in the industry. PAYC outperforms 91.25% of its industry peers.
Why is NYSE:PAYC a setup?
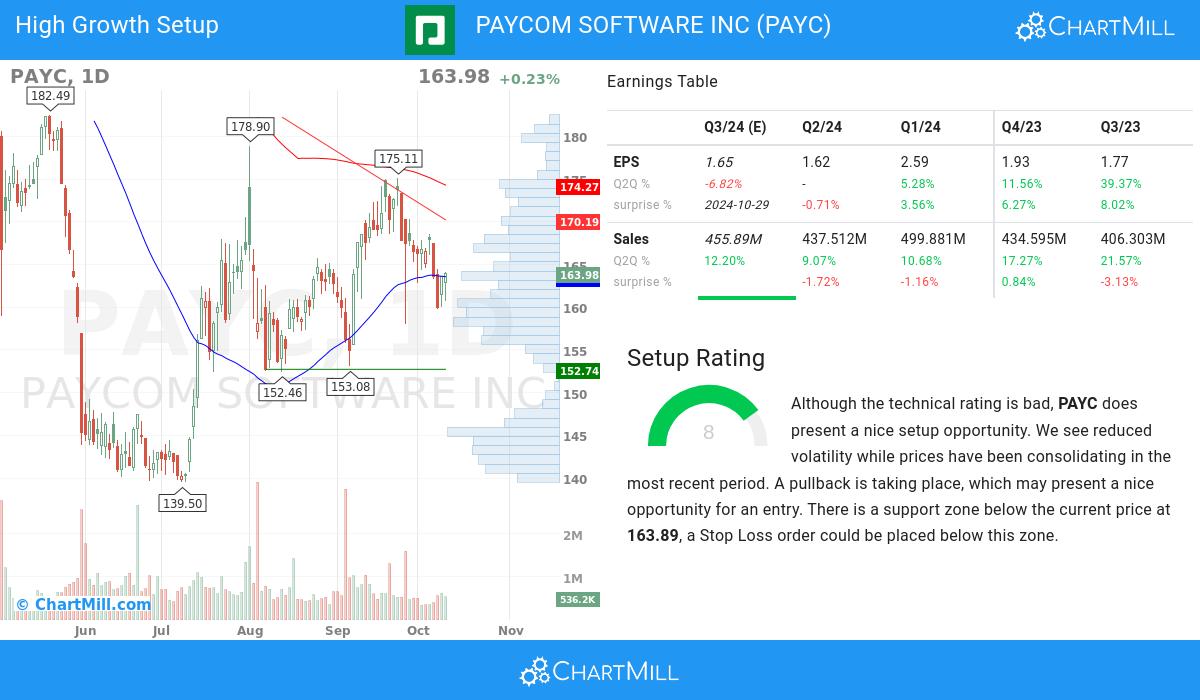
In addition to the Technical Rating, ChartMill provides a Setup Rating for each stock. This rating, ranging from 0 to 10, assesses the level of consolidation in the stock based on multiple short-term technical indicators. Currently, NYSE:PAYC has a 8 as its setup rating, indicating its current consolidation status.
PAYC has a bad technical rating, but it does show a decent setup pattern. We see reduced volatility while prices have been consolidating in the most recent period. A pullback is taking place, which may present a nice opportunity for an entry. There is a support zone below the current price at 163.89, a Stop Loss order could be placed below this zone.
Our Strong Growth screener lists more Strong Growth stocks and is updated daily.
Check the latest full fundamental report of PAYC for a complete fundamental analysis.
Check the latest full technical report of PAYC for a complete technical analysis.
Keep in mind
This article should in no way be interpreted as advice. The article is based on the observed metrics at the time of writing, but you should always make your own analysis and trade or invest at your own responsibility.
216.91
+1.38 (+0.64%)
Find more stocks in the Stock Screener
PAYC Latest News and Analysis
 3 days ago - ChartmillWondering what's happening in today's S&P500 pre-market session?
Let's have a look at what is happening on the US markets before the opening bell on Tuesday. Below you can find the top S&P500 gainers and losers in today's pre-market session.
 9 days ago - ChartmillTop S&P500 movers in Wednesday's after hours session
Wondering what's happening in today's after-hours session with S&P500 stocks? Stay tuned for the latest updates on movers and shakers.
