
NYSE:PAYC, a strong growth stock, setting up for a breakout.
By Mill Chart
Last update: Sep 18, 2024
In this article, we'll take a closer look at PAYCOM SOFTWARE INC (NYSE:PAYC) as a potential candidate for growth investing. While it's important for investors to conduct their own research, PAYCOM SOFTWARE INC has piqued our interest by appearing on our strong growth and breakout radar. Let's explore further.
Looking at the Growth
ChartMill assigns a proprietary Growth Rating to each stock. The score is computed by evaluating various growth aspects, like EPS and revenue growth. We take into account the history as well as the estimated future numbers. NYSE:PAYC was assigned a score of 8 for growth:
- The Earnings Per Share has grown by an nice 11.72% over the past year.
- Measured over the past years, PAYC shows a very strong growth in Earnings Per Share. The EPS has been growing by 23.85% on average per year.
- PAYC shows quite a strong growth in Revenue. In the last year, the Revenue has grown by 14.18%.
- PAYC shows a strong growth in Revenue. Measured over the last years, the Revenue has been growing by 24.50% yearly.
- The Earnings Per Share is expected to grow by 12.10% on average over the next years. This is quite good.
- The Revenue is expected to grow by 11.79% on average over the next years. This is quite good.
Health Insights: NYSE:PAYC
ChartMill employs a unique Health Rating system for all stocks. This rating, ranging from 0 to 10, is determined by analyzing various liquidity and solvency ratios. For NYSE:PAYC, the assigned 8 for health provides valuable insights:
- An Altman-Z score of 3.59 indicates that PAYC is not in any danger for bankruptcy at the moment.
- PAYC has a Altman-Z score of 3.59. This is in the better half of the industry: PAYC outperforms 67.50% of its industry peers.
- There is no outstanding debt for PAYC. This means it has a Debt/Equity and Debt/FCF ratio of 0 and it is amongst the best of the sector and industry.
- The current and quick ratio evaluation for PAYC is rather negative, while it does have excellent solvency and profitability. These ratios do not necessarly indicate liquidity issues and need to be evaluated against the specifics of the business.
A Closer Look at Profitability for NYSE:PAYC
ChartMill assigns a proprietary Profitability Rating to each stock. The score is computed by evaluating various profitability ratios and margins and ranges from 0 to 10. NYSE:PAYC was assigned a score of 8 for profitability:
- PAYC's Return On Assets of 10.95% is amongst the best of the industry. PAYC outperforms 86.25% of its industry peers.
- PAYC's Return On Equity of 33.10% is amongst the best of the industry. PAYC outperforms 86.25% of its industry peers.
- The Return On Invested Capital of PAYC (23.63%) is better than 91.25% of its industry peers.
- The Average Return On Invested Capital over the past 3 years for PAYC is above the industry average of 12.67%.
- The 3 year average ROIC (17.49%) for PAYC is below the current ROIC(23.63%), indicating increased profibility in the last year.
- PAYC has a Profit Margin of 26.55%. This is amongst the best in the industry. PAYC outperforms 95.00% of its industry peers.
- PAYC has a better Operating Margin (32.87%) than 96.25% of its industry peers.
- The Gross Margin of PAYC (82.79%) is better than 91.25% of its industry peers.
How does the Setup look for NYSE:PAYC
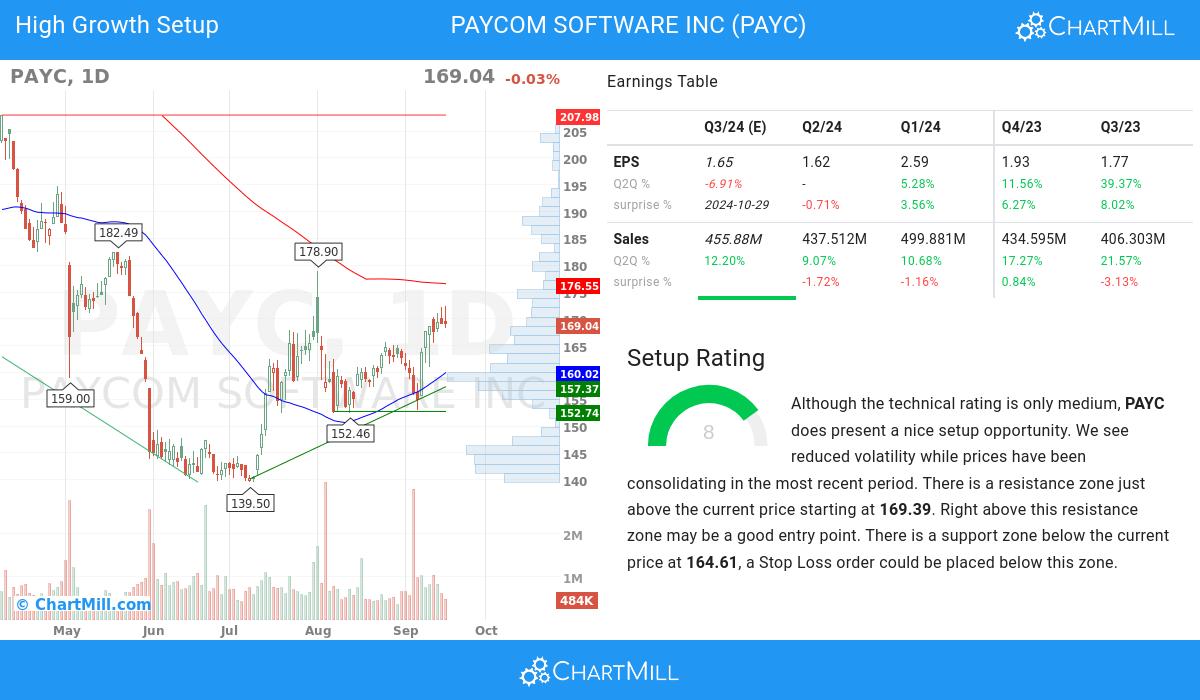
Besides the Technical Rating, ChartMill also assign a Setup Rating to every stock. This setup score also ranges from 0 to 10 and determines to which extend the stock is consolidating. This is achieved by evaluating multiple short term technical indicators. NYSE:PAYC currently has a 8 as setup rating:
Although the technical rating is only medium, PAYC does present a nice setup opportunity. Prices have been consolidating lately and the volatility has been reduced. There is a resistance zone just above the current price starting at 169.39. Right above this resistance zone may be a good entry point. There is a support zone below the current price at 164.61, a Stop Loss order could be placed below this zone.
Our Strong Growth screener lists more Strong Growth stocks and is updated daily.
For an up to date full fundamental analysis you can check the fundamental report of PAYC
For an up to date full technical analysis you can check the technical report of PAYC
Disclaimer
This article should in no way be interpreted as advice. The article is based on the observed metrics at the time of writing, but you should always make your own analysis and trade or invest at your own responsibility.
216.91
+1.38 (+0.64%)
Find more stocks in the Stock Screener
PAYC Latest News and Analysis
 3 days ago - ChartmillWondering what's happening in today's S&P500 pre-market session?
Let's have a look at what is happening on the US markets before the opening bell on Tuesday. Below you can find the top S&P500 gainers and losers in today's pre-market session.
 8 days ago - ChartmillTop S&P500 movers in Wednesday's after hours session
Wondering what's happening in today's after-hours session with S&P500 stocks? Stay tuned for the latest updates on movers and shakers.
