Does PAN AMERICAN SILVER CORP (NYSE:PAAS) align with Mark Minervini’s trading strategy?
By Mill Chart
Last update: Mar 19, 2025
In this article we will dive into PAN AMERICAN SILVER CORP (NYSE:PAAS) as a possible candidate for growth investing. Investors should always do their own research, but we noticed PAN AMERICAN SILVER CORP showing up in our Minervini growth screen, which makes it worth to investigate a bit more.
A Technical Analysis using the Minervini Trend Template.
The Minervini Trend Template is a set of technical criteria designed to identify stocks in strong uptrends. We can check all the boxes for PAAS:
- ✔ Relative Strength is above 70.
- ✔ Current price is within 25% of it's 52-week high.
- ✔ Current price is at least 30% above it's 52-week low.
- ✔ The current price is above the 50-, 150- and 200-day SMA price line.
- ✔ The SMA(200) is trending upwards.
- ✔ The SMA(150) is above the SMA(200)
- ✔ The SMA(50) is above the SMA(150) and the SMA(200)
Looking into the high growth metrics of PAAS
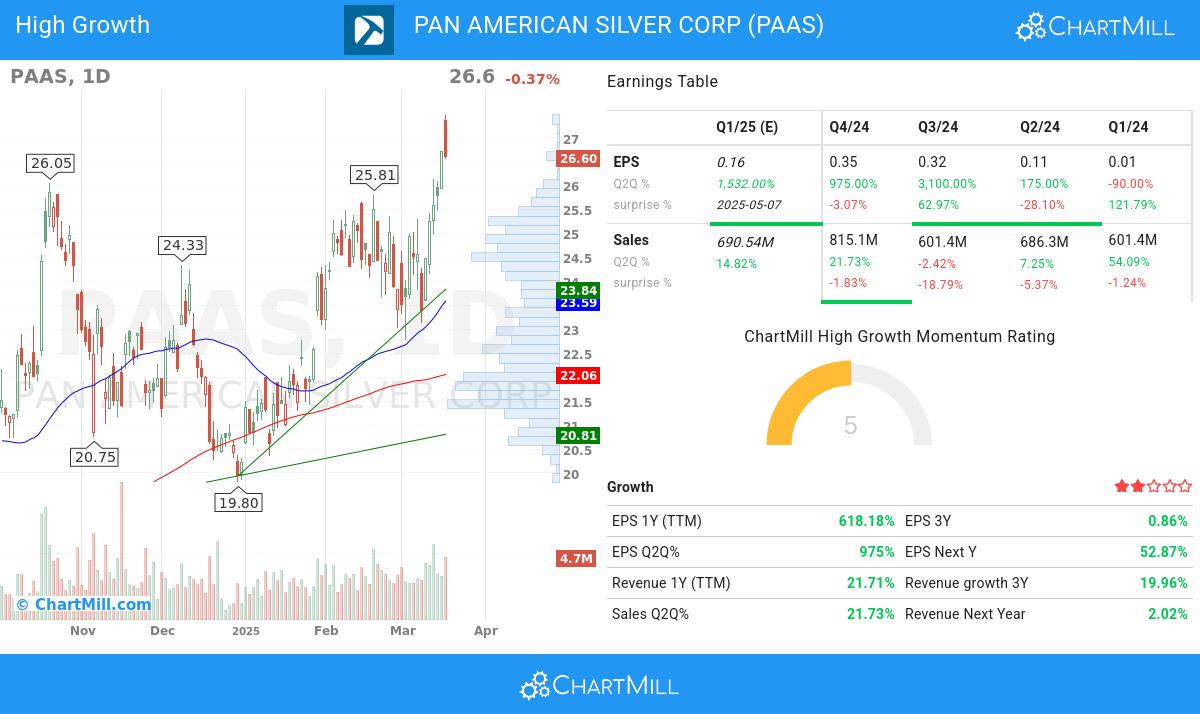
To evaluate a stock's growth potential, ChartMill utilizes a High Growth Momentum Rating (HGM) on a scale of 0 to 10. This assessment considers various growth and profitability aspects, like EPS and revenue growth, accelleration, surprises and revisions. PAAS has achieved a 5 out of 10:
Earnings Momentum
- The EPS of PAAS has exhibited growth from one quarter to another (Q2Q), with a 975.0% increase. This underscores the company's ability to generate higher earnings and improve its financial standing.
- The 1-year EPS growth of PAAS (618.0%) highlights the company's ability to consistently improve its earnings performance and suggests a positive outlook for future profitability.
- PAAS has demonstrated strong quarter-to-quarter (Q2Q) revenue growth of 21.73%, reflecting its ability to generate consistent increases in sales. This growth highlights the company's effective market positioning and its potential for continued success.
- Accelerating Sales growth for PAAS: the current Q2Q growth of 21.73% exceeds the previous quarter Q2Q growth of 16.19%.
- Sales growth accelerated for 2 quarters in a row.
- With notable 1-year revenue growth of 21.71%, PAAS exemplifies its ability to generate increased sales and revenue streams. This growth signifies the company's strong business performance and its potential for future growth.
Financial Strength & Profitability
- With a favorable trend in its operating margin over the past year, PAAS demonstrates its ability to enhance profitability through efficient operations. This growth reflects the company's focus on optimizing its cost structure.
- With a favorable trend in its free cash flow (FCF) over the past year, PAAS demonstrates its ability to generate robust cash flows and maintain financial stability. This growth reflects the company's focus on efficient capital allocation and cash management.
- PAAS's Debt/Equity ratio of 0.16 suggests a healthy balance between debt financing and shareholder equity.
Market Strength & Institutional Confidence
- With 58.92% of the total shares held by institutional investors, PAAS showcases a healthy distribution of ownership. This suggests a mix of institutional and retail investors, fostering a dynamic market for the stock.
- The Relative Strength (RS) of PAAS has been consistently solid, with a current 96.82 rating. This highlights the stock's ability to exhibit sustained price strength and signifies its competitive advantage.
Looking at the Setup
ChartMill provides a Setup Rating for each stock. This rating, ranging from 0 to 10, assesses the level of consolidation in the stock based on multiple short-term technical indicators. Currently, PAAS has a 3 as its setup rating, indicating its current consolidation status.
Although PAAS has an excellent technical rating, it does not offer a high quality setup at the moment. Price movement has been a little bit too volatile to find a nice entry and exit point. It is probably a good idea to wait for a consolidation first.
Our latest full technical report of PAAS contains the most current technical analsysis.
Concluding
Our High Growth Momentum + Trend Template screen will find you more ideas which meet the Minervini criteria.
Disclaimer
Important Note: The content of this article is not intended as trading advice. It is essential to perform your own analysis and exercise caution when making trading decisions. The article presents observations created by automated analysis but does not guarantee any trading or investment outcomes. Always trade responsibly and make independent judgments.
27.2
-0.82 (-2.93%)
Find more stocks in the Stock Screener
PAAS Latest News and Analysis
 8 days ago - ChartmillEvaluating PAN AMERICAN SILVER CORP (NYSE:PAAS) using Mark Minervini’s winning stock formula
A fundamental and technical analysis of (NYSE:PAAS): Why the high growth investor may take a look at PAN AMERICAN SILVER CORP (NYSE:PAAS).
