
Looking for growth without the hefty price tag? Consider ONTO INNOVATION INC (NYSE:ONTO).
By Mill Chart
Last update: Mar 29, 2025
Consider ONTO INNOVATION INC (NYSE:ONTO) as an affordable growth stock, identified by our stock screening tool. ONTO is showcasing impressive growth figures and is well-positioned in terms of profitability, solvency, and liquidity. Moreover, it seems to be priced reasonably. Let's dive deeper into the analysis.
How We Gauge Growth for ONTO
ChartMill employs its own Growth Rating system for all stocks. This score, ranging from 0 to 10, is derived by evaluating different growth factors, such as EPS and revenue growth, taking into account both past performance and future projections. ONTO has earned a 9 for growth:
- ONTO shows a strong growth in Earnings Per Share. In the last year, the EPS has been growing by 43.43%, which is quite impressive.
- Measured over the past years, ONTO shows a very strong growth in Earnings Per Share. The EPS has been growing by 36.96% on average per year.
- The Revenue has grown by 21.00% in the past year. This is a very strong growth!
- The Revenue has been growing by 26.41% on average over the past years. This is a very strong growth!
- ONTO is expected to show a strong growth in Earnings Per Share. In the coming years, the EPS will grow by 21.31% yearly.
- The Revenue is expected to grow by 16.21% on average over the next years. This is quite good.
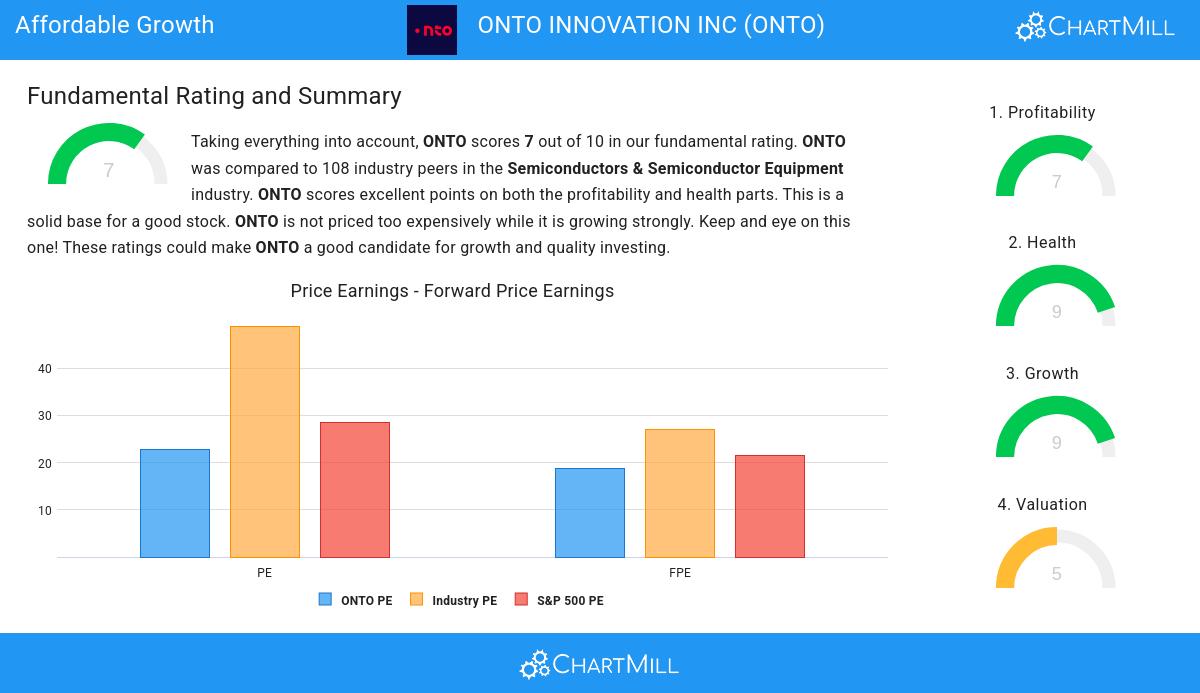
How We Gauge Valuation for ONTO
ChartMill employs its own Valuation Rating system for all stocks. This score, ranging from 0 to 10, is determined by evaluating different valuation factors, including price to earnings and free cash flow, both in absolute terms and relative to the market and industry. ONTO has earned a 5 for valuation:
- Based on the Price/Earnings ratio, ONTO is valued a bit cheaper than the industry average as 71.30% of the companies are valued more expensively.
- ONTO's Price/Forward Earnings ratio is a bit cheaper when compared to the industry. ONTO is cheaper than 74.07% of the companies in the same industry.
- Based on the Enterprise Value to EBITDA ratio, ONTO is valued a bit cheaper than the industry average as 74.07% of the companies are valued more expensively.
- Compared to the rest of the industry, the Price/Free Cash Flow ratio of ONTO indicates a somewhat cheap valuation: ONTO is cheaper than 72.22% of the companies listed in the same industry.
- ONTO has a very decent profitability rating, which may justify a higher PE ratio.
- A more expensive valuation may be justified as ONTO's earnings are expected to grow with 22.10% in the coming years.
Assessing Health Metrics for ONTO
ChartMill employs its own Health Rating for stock assessment. This rating, ranging from 0 to 10, is calculated by examining various liquidity and solvency ratios. In the case of ONTO, the assigned 9 reflects its health status:
- An Altman-Z score of 21.82 indicates that ONTO is not in any danger for bankruptcy at the moment.
- Looking at the Altman-Z score, with a value of 21.82, ONTO belongs to the top of the industry, outperforming 90.74% of the companies in the same industry.
- There is no outstanding debt for ONTO. This means it has a Debt/Equity and Debt/FCF ratio of 0 and it is amongst the best of the sector and industry.
- ONTO has a Current Ratio of 8.69. This indicates that ONTO is financially healthy and has no problem in meeting its short term obligations.
- ONTO's Current ratio of 8.69 is amongst the best of the industry. ONTO outperforms 95.37% of its industry peers.
- A Quick Ratio of 7.00 indicates that ONTO has no problem at all paying its short term obligations.
- The Quick ratio of ONTO (7.00) is better than 92.59% of its industry peers.
What does the Profitability looks like for ONTO
ChartMill employs its own Profitability Rating system for stock evaluation. This score, ranging from 0 to 10, is derived from an analysis of diverse profitability metrics and margins. In the case of ONTO, the assigned 7 is noteworthy for profitability:
- Looking at the Return On Assets, with a value of 9.53%, ONTO is in the better half of the industry, outperforming 76.85% of the companies in the same industry.
- ONTO's Return On Equity of 10.47% is fine compared to the rest of the industry. ONTO outperforms 67.59% of its industry peers.
- ONTO has a better Return On Invested Capital (9.57%) than 75.93% of its industry peers.
- With an excellent Profit Margin value of 20.43%, ONTO belongs to the best of the industry, outperforming 81.48% of the companies in the same industry.
- ONTO's Profit Margin has improved in the last couple of years.
- ONTO's Operating Margin of 20.64% is fine compared to the rest of the industry. ONTO outperforms 78.70% of its industry peers.
- With a decent Gross Margin value of 53.88%, ONTO is doing good in the industry, outperforming 74.07% of the companies in the same industry.
- In the last couple of years the Gross Margin of ONTO has grown nicely.
Our Affordable Growth screener lists more Affordable Growth stocks and is updated daily.
Our latest full fundamental report of ONTO contains the most current fundamental analsysis.
Disclaimer
Important Note: The content of this article is not intended as trading advice. It is essential to perform your own analysis and exercise caution when making trading decisions. The article presents observations created by automated analysis but does not guarantee any trading or investment outcomes. Always trade responsibly and make independent judgments.
