In the world of growth stocks, NYSE:ONTO shines as a value proposition.
By Mill Chart
Last update: Feb 11, 2025
Here's ONTO INNOVATION INC (NYSE:ONTO) for you, a growth stock our stock screener believes is undervalued. NYSE:ONTO is scoring impressively in terms of growth while demonstrating strong financials. On top of that, it remains attractively priced. Let's break it down further.
A Closer Look at Growth for NYSE:ONTO
To evaluate a stock's growth potential, ChartMill utilizes a Growth Rating on a scale of 0 to 10. This comprehensive assessment considers various growth aspects, including historical and estimated EPS and revenue growth. NYSE:ONTO has achieved a 9 out of 10:
- ONTO shows a strong growth in Earnings Per Share. In the last year, the EPS has been growing by 43.43%, which is quite impressive.
- Measured over the past years, ONTO shows a very strong growth in Earnings Per Share. The EPS has been growing by 36.96% on average per year.
- Looking at the last year, ONTO shows a very strong growth in Revenue. The Revenue has grown by 21.00%.
- The Revenue has been growing by 26.41% on average over the past years. This is a very strong growth!
- ONTO is expected to show a strong growth in Earnings Per Share. In the coming years, the EPS will grow by 22.01% yearly.
- The Revenue is expected to grow by 18.32% on average over the next years. This is quite good.
Valuation Analysis for NYSE:ONTO
An integral part of ChartMill's stock analysis is the Valuation Rating, which spans from 0 to 10. This rating evaluates diverse valuation factors, including price to earnings and cash flows, while considering the stock's profitability and growth. NYSE:ONTO has received a 5 out of 10:
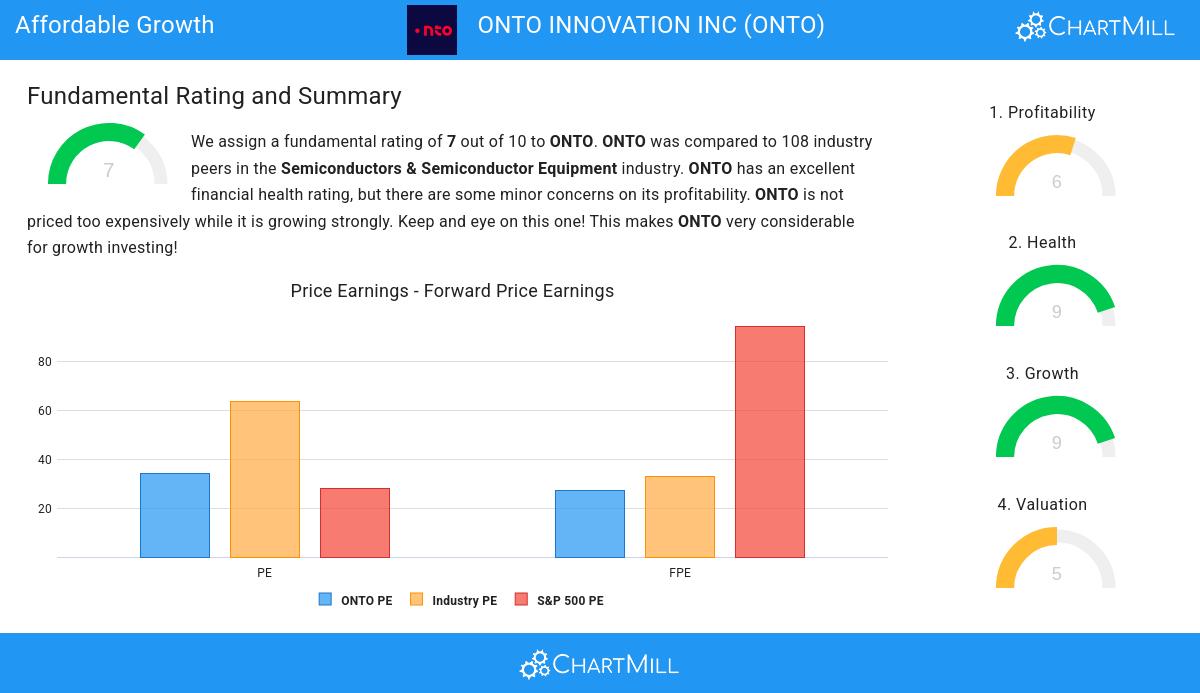
- Based on the Price/Earnings ratio, ONTO is valued a bit cheaper than 64.81% of the companies in the same industry.
- Based on the Price/Forward Earnings ratio, ONTO is valued a bit cheaper than 62.04% of the companies in the same industry.
- ONTO is valuated cheaply when we compare the Price/Forward Earnings ratio to 94.48, which is the current average of the S&P500 Index.
- Based on the Enterprise Value to EBITDA ratio, ONTO is valued a bit cheaper than 60.19% of the companies in the same industry.
- Compared to the rest of the industry, the Price/Free Cash Flow ratio of ONTO indicates a somewhat cheap valuation: ONTO is cheaper than 71.30% of the companies listed in the same industry.
- ONTO has a very decent profitability rating, which may justify a higher PE ratio.
- A more expensive valuation may be justified as ONTO's earnings are expected to grow with 20.64% in the coming years.
How We Gauge Health for NYSE:ONTO
ChartMill utilizes a Health Rating to assess stocks, scoring them on a scale of 0 to 10. This rating takes into account a variety of liquidity and solvency ratios, both in absolute terms and in comparison to industry peers. NYSE:ONTO has earned a 9 out of 10:
- An Altman-Z score of 33.91 indicates that ONTO is not in any danger for bankruptcy at the moment.
- The Altman-Z score of ONTO (33.91) is better than 92.59% of its industry peers.
- ONTO has no outstanding debt. Therefor its Debt/Equity and Debt/FCF ratios are 0 and belong to the best of the industry.
- A Current Ratio of 10.07 indicates that ONTO has no problem at all paying its short term obligations.
- ONTO has a Current ratio of 10.07. This is amongst the best in the industry. ONTO outperforms 96.30% of its industry peers.
- ONTO has a Quick Ratio of 7.94. This indicates that ONTO is financially healthy and has no problem in meeting its short term obligations.
- With an excellent Quick ratio value of 7.94, ONTO belongs to the best of the industry, outperforming 95.37% of the companies in the same industry.
Profitability Insights: NYSE:ONTO
ChartMill employs its own Profitability Rating system for stock evaluation. This score, ranging from 0 to 10, is derived from an analysis of diverse profitability metrics and margins. In the case of NYSE:ONTO, the assigned 6 is noteworthy for profitability:
- With a decent Return On Assets value of 8.83%, ONTO is doing good in the industry, outperforming 74.07% of the companies in the same industry.
- ONTO has a better Return On Equity (9.62%) than 66.67% of its industry peers.
- With a decent Return On Invested Capital value of 8.54%, ONTO is doing good in the industry, outperforming 75.93% of the companies in the same industry.
- ONTO has a Profit Margin of 19.44%. This is in the better half of the industry: ONTO outperforms 77.78% of its industry peers.
- ONTO's Profit Margin has improved in the last couple of years.
- With a decent Operating Margin value of 19.12%, ONTO is doing good in the industry, outperforming 76.85% of the companies in the same industry.
- The Gross Margin of ONTO (52.87%) is better than 69.44% of its industry peers.
- In the last couple of years the Gross Margin of ONTO has grown nicely.
Our Affordable Growth screener lists more Affordable Growth stocks and is updated daily.
Our latest full fundamental report of ONTO contains the most current fundamental analsysis.
Disclaimer
This article should in no way be interpreted as advice. The article is based on the observed metrics at the time of writing, but you should always make your own analysis and trade or invest at your own responsibility.
112.15
-2.84 (-2.47%)
Find more stocks in the Stock Screener
ONTO Latest News and Analysis
 9 hours ago - ChartmillIn the world of growth stocks, ONTO INNOVATION INC (NYSE:ONTO) shines as a value proposition.
Discover ONTO INNOVATION INC, an undervalued growth gem. NYSE:ONTO is shining in terms of growth metrics, and it's also displaying strong financial health and profitability, retaining an appealing valuation.
