
ON SEMICONDUCTOR (NASDAQ:ON), an undervalued stock with good fundamentals.
By Mill Chart
Last update: Apr 1, 2025
ON SEMICONDUCTOR (NASDAQ:ON) has caught the attention of our stock screener as a great value stock. ON excels in profitability, solvency, and liquidity, all while being very reasonably priced. Let's delve into the details.
What does the Valuation looks like for ON
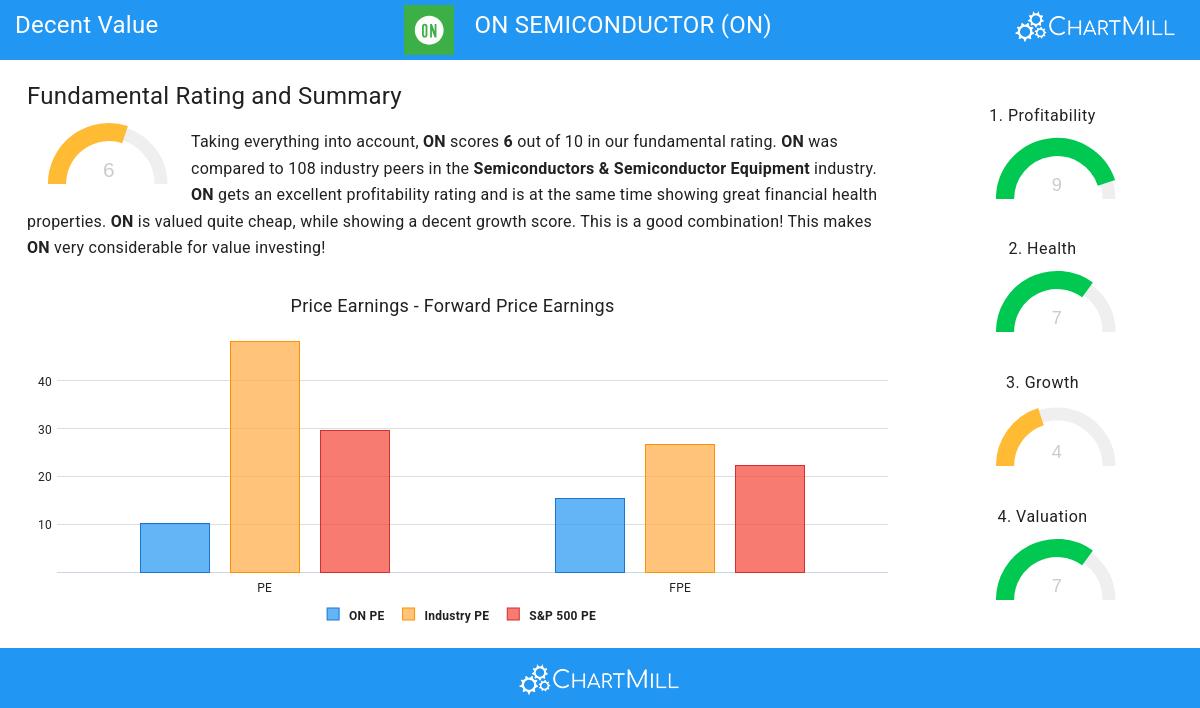
ChartMill assigns a proprietary Valuation Rating to each stock. The score is computed by evaluating various valuation aspects, like price to earnings and free cash flow, both absolutely as relative to the market and industry. ON was assigned a score of 7 for valuation:
- With a Price/Earnings ratio of 10.22, the valuation of ON can be described as very reasonable.
- Based on the Price/Earnings ratio, ON is valued cheaply inside the industry as 94.44% of the companies are valued more expensively.
- ON's Price/Earnings ratio indicates a rather cheap valuation when compared to the S&P500 average which is at 29.51.
- Based on the Price/Forward Earnings ratio, ON is valued cheaply inside the industry as 83.33% of the companies are valued more expensively.
- Compared to an average S&P500 Price/Forward Earnings ratio of 22.30, ON is valued a bit cheaper.
- Based on the Enterprise Value to EBITDA ratio, ON is valued cheaper than 91.67% of the companies in the same industry.
- ON's Price/Free Cash Flow ratio is rather cheap when compared to the industry. ON is cheaper than 92.59% of the companies in the same industry.
- ON has an outstanding profitability rating, which may justify a higher PE ratio.
Profitability Examination for ON
ChartMill employs its own Profitability Rating system for stock evaluation. This score, ranging from 0 to 10, is derived from an analysis of diverse profitability metrics and margins. In the case of ON, the assigned 9 is noteworthy for profitability:
- ON has a better Return On Assets (11.16%) than 79.63% of its industry peers.
- With an excellent Return On Equity value of 17.88%, ON belongs to the best of the industry, outperforming 81.48% of the companies in the same industry.
- The Return On Invested Capital of ON (12.81%) is better than 83.33% of its industry peers.
- Measured over the past 3 years, the Average Return On Invested Capital for ON is significantly above the industry average of 11.55%.
- The 3 year average ROIC (19.04%) for ON is well above the current ROIC(12.81%). The reason for the recent decline needs to be investigated.
- With an excellent Profit Margin value of 22.21%, ON belongs to the best of the industry, outperforming 83.33% of the companies in the same industry.
- In the last couple of years the Profit Margin of ON has grown nicely.
- ON has a better Operating Margin (26.85%) than 87.04% of its industry peers.
- ON's Operating Margin has improved in the last couple of years.
- ON's Gross Margin has improved in the last couple of years.
How do we evaluate the Health for ON?
ChartMill employs a unique Health Rating system for all stocks. This rating, ranging from 0 to 10, is determined by analyzing various liquidity and solvency ratios. For ON, the assigned 7 for health provides valuable insights:
- ON has an Altman-Z score of 4.16. This indicates that ON is financially healthy and has little risk of bankruptcy at the moment.
- The Debt to FCF ratio of ON is 2.78, which is a good value as it means it would take ON, 2.78 years of fcf income to pay off all of its debts.
- ON's Debt to FCF ratio of 2.78 is fine compared to the rest of the industry. ON outperforms 66.67% of its industry peers.
- ON has a Debt/Equity ratio of 0.38. This is a healthy value indicating a solid balance between debt and equity.
- ON has a Current Ratio of 5.06. This indicates that ON is financially healthy and has no problem in meeting its short term obligations.
- ON has a better Current ratio (5.06) than 76.85% of its industry peers.
- A Quick Ratio of 3.38 indicates that ON has no problem at all paying its short term obligations.
- The Quick ratio of ON (3.38) is better than 66.67% of its industry peers.
Growth Examination for ON
ChartMill assigns a Growth Rating to each stock, ranging from 0 to 10. This rating is determined by analyzing different growth elements, including EPS and revenue growth, spanning both historical and future figures. In the case of ON, the assigned 4 reflects its growth potential:
- Measured over the past years, ON shows a very strong growth in Earnings Per Share. The EPS has been growing by 21.88% on average per year.
- The Earnings Per Share is expected to grow by 10.02% on average over the next years. This is quite good.
Our Decent Value screener lists more Decent Value stocks and is updated daily.
Check the latest full fundamental report of ON for a complete fundamental analysis.
Disclaimer
This article should in no way be interpreted as advice. The article is based on the observed metrics at the time of writing, but you should always make your own analysis and trade or invest at your own responsibility.
36.62
+1.17 (+3.3%)
Find more stocks in the Stock Screener
ON Latest News and Analysis
 11 hours ago - ChartmillWhich S&P500 stocks are moving after the closing bell on Wednesday?
Let's have a look at what is happening on the US markets after the closing bell on Wednesday. Below you can find the top S&P500 gainers and losers in today's after hours session.
 8 days ago - ChartmillStay informed with the top movers within the S&P500 index on Wednesday.
Let's delve into the developments on the US markets one hour before the close of the markets on Wednesday. Below, you'll find the top gainers and losers within the S&P500 index during today's session.
13 days ago - ChartmillWhich S&P500 stocks are moving on Friday?Curious about the S&P500 stocks that are in motion on Friday? Join us as we explore the top movers within the S&P500 index during today's session.
 13 days ago - ChartmillWhich S&P500 stocks are gapping on Friday?
Curious about the S&P500 stocks that are gapping on Friday? Explore the gap up and gap down stocks in the S&P500 index during today's session.
14 days ago - ChartmillTop S&P500 movers in Thursday's sessionLet's have a look at what is happening on the US markets one hour before the close of the markets on Thursday. Below you can find the top S&P500 gainers and losers in today's session.
14 days ago - ChartmillWhat's going on in today's session: S&P500 moversStay updated with the movements of the S&P500 index in the middle of the day on Thursday. Discover which stocks are leading as top gainers and losers in today's session.
14 days ago - ChartmillGapping S&P500 stocks in Thursday's sessionLet's take a look at the S&P500 stocks that are experiencing notable price gaps in today's session on Thursday. Discover the gap up and gap down stocks in the S&P500 index.
15 days ago - ChartmillThese S&P500 stocks are moving in today's sessionGet insights into the S&P500 index performance on Wednesday. Explore the top gainers and losers within the S&P500 index in today's session.
16 days ago - ChartmillTuesday's session: top gainers and losers in the S&P500 indexCurious about the top performers within the S&P500 index one hour before the close of the markets on Tuesday? Dive into the list of today's session's top gainers and losers for a comprehensive overview.
