
For those who appreciate value investing, NASDAQ:ON is a compelling option with its solid fundamentals.
By Mill Chart
Last update: Feb 11, 2025
Uncover the potential of ON SEMICONDUCTOR (NASDAQ:ON) as our stock screener's choice for an undervalued stock. NASDAQ:ON maintains a strong financial position and offers an appealing valuation. We'll delve into the specifics below.
Looking at the Valuation
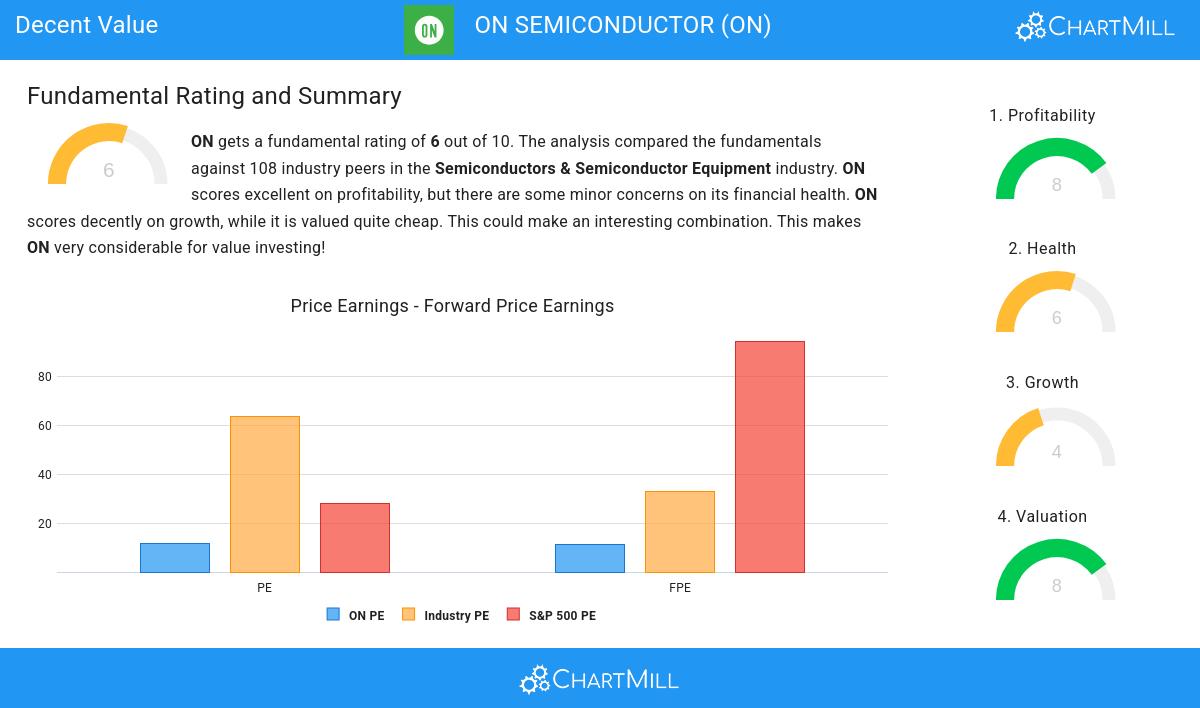
ChartMill assigns a proprietary Valuation Rating to each stock. The score is computed by evaluating various valuation aspects, like price to earnings and free cash flow, both absolutely as relative to the market and industry. NASDAQ:ON was assigned a score of 8 for valuation:
- The Price/Earnings ratio is 11.82, which indicates a very decent valuation of ON.
- Based on the Price/Earnings ratio, ON is valued cheaply inside the industry as 93.52% of the companies are valued more expensively.
- ON is valuated cheaply when we compare the Price/Earnings ratio to 28.20, which is the current average of the S&P500 Index.
- A Price/Forward Earnings ratio of 11.13 indicates a reasonable valuation of ON.
- ON's Price/Forward Earnings ratio is rather cheap when compared to the industry. ON is cheaper than 94.44% of the companies in the same industry.
- The average S&P500 Price/Forward Earnings ratio is at 94.48. ON is valued rather cheaply when compared to this.
- Based on the Enterprise Value to EBITDA ratio, ON is valued cheaper than 91.67% of the companies in the same industry.
- 87.04% of the companies in the same industry are more expensive than ON, based on the Price/Free Cash Flow ratio.
- ON has an outstanding profitability rating, which may justify a higher PE ratio.
- A more expensive valuation may be justified as ON's earnings are expected to grow with 20.91% in the coming years.
Exploring NASDAQ:ON's Profitability
ChartMill utilizes a Profitability Rating to assess stocks, scoring them on a scale of 0 to 10. This rating takes into account a variety of profitability ratios and margins, both in absolute terms and in comparison to industry peers. NASDAQ:ON has earned a 8 out of 10:
- ON has a better Return On Assets (12.61%) than 78.70% of its industry peers.
- ON has a Return On Equity of 20.45%. This is amongst the best in the industry. ON outperforms 85.19% of its industry peers.
- Looking at the Return On Invested Capital, with a value of 14.75%, ON belongs to the top of the industry, outperforming 86.11% of the companies in the same industry.
- Measured over the past 3 years, the Average Return On Invested Capital for ON is significantly above the industry average of 12.01%.
- The 3 year average ROIC (19.02%) for ON is well above the current ROIC(14.75%). The reason for the recent decline needs to be investigated.
- The Profit Margin of ON (23.80%) is better than 84.26% of its industry peers.
- In the last couple of years the Profit Margin of ON has grown nicely.
- The Operating Margin of ON (28.27%) is better than 88.89% of its industry peers.
- In the last couple of years the Operating Margin of ON has grown nicely.
- In the last couple of years the Gross Margin of ON has grown nicely.
Assessing Health Metrics for NASDAQ:ON
ChartMill employs its own Health Rating for stock assessment. This rating, ranging from 0 to 10, is calculated by examining various liquidity and solvency ratios. In the case of NASDAQ:ON, the assigned 6 reflects its health status:
- An Altman-Z score of 4.43 indicates that ON is not in any danger for bankruptcy at the moment.
- The Debt to FCF ratio of ON is 3.37, which is a good value as it means it would take ON, 3.37 years of fcf income to pay off all of its debts.
- With a decent Debt to FCF ratio value of 3.37, ON is doing good in the industry, outperforming 65.74% of the companies in the same industry.
- A Debt/Equity ratio of 0.30 indicates that ON is not too dependend on debt financing.
- A Current Ratio of 3.07 indicates that ON has no problem at all paying its short term obligations.
- A Quick Ratio of 2.02 indicates that ON has no problem at all paying its short term obligations.
Growth Insights: NASDAQ:ON
Every stock receives a Growth Rating from ChartMill, ranging from 0 to 10. This rating assesses various growth aspects, including historical and projected EPS and revenue growth. NASDAQ:ON boasts a 4 out of 10:
- ON shows a strong growth in Earnings Per Share. Measured over the last years, the EPS has been growing by 21.88% yearly.
- Based on estimates for the next years, ON will show a very strong growth in Earnings Per Share. The EPS will grow by 23.62% on average per year.
- ON is expected to show quite a strong growth in Revenue. In the coming years, the Revenue will grow by 11.66% yearly.
Our Decent Value screener lists more Decent Value stocks and is updated daily.
Our latest full fundamental report of ON contains the most current fundamental analsysis.
Disclaimer
This is not investing advice! The article highlights some of the observations at the time of writing, but you should always make your own analysis and invest based on your own insights.
54.96
-1.01 (-1.8%)
Find more stocks in the Stock Screener
ON Latest News and Analysis


