
NASDAQ:OLED—A High-Growth Stock Gearing Up for Its Next Upward Move.
By Mill Chart
Last update: Jan 31, 2025
Growth investors are on the lookout for stocks displaying robust revenue and EPS growth. In this analysis, we'll assess whether UNIVERSAL DISPLAY CORP (NASDAQ:OLED) aligns with growth investing criteria, especially as it consolidates and signals a possible breakout. As always, investors should conduct their own research, but UNIVERSAL DISPLAY CORP has surfaced on our radar for growth with base formation, warranting further examination.
How do we evaluate the Growth for NASDAQ:OLED?
Every stock receives a Growth Rating from ChartMill, ranging from 0 to 10. This rating assesses various growth aspects, including historical and projected EPS and revenue growth. NASDAQ:OLED boasts a 8 out of 10:
- The Earnings Per Share has grown by an nice 15.55% over the past year.
- Measured over the past years, OLED shows a very strong growth in Earnings Per Share. The EPS has been growing by 27.88% on average per year.
- The Revenue has grown by 37.77% in the past year. This is a very strong growth!
- Measured over the past years, OLED shows a quite strong growth in Revenue. The Revenue has been growing by 18.43% on average per year.
- OLED is expected to show a strong growth in Earnings Per Share. In the coming years, the EPS will grow by 20.82% yearly.
- The Revenue is expected to grow by 17.44% on average over the next years. This is quite good.
Evaluating Health: NASDAQ:OLED
To gauge a stock's financial health, ChartMill utilizes a Health Rating on a scale of 0 to 10. This comprehensive evaluation encompasses liquidity and solvency, both in absolute terms and in comparison to industry peers. NASDAQ:OLED has earned a 9 out of 10:
- An Altman-Z score of 21.49 indicates that OLED is not in any danger for bankruptcy at the moment.
- OLED has a Altman-Z score of 21.49. This is amongst the best in the industry. OLED outperforms 88.89% of its industry peers.
- There is no outstanding debt for OLED. This means it has a Debt/Equity and Debt/FCF ratio of 0 and it is amongst the best of the sector and industry.
- A Current Ratio of 7.18 indicates that OLED has no problem at all paying its short term obligations.
- The Current ratio of OLED (7.18) is better than 89.81% of its industry peers.
- A Quick Ratio of 5.84 indicates that OLED has no problem at all paying its short term obligations.
- OLED has a Quick ratio of 5.84. This is amongst the best in the industry. OLED outperforms 89.81% of its industry peers.
Profitability Examination for NASDAQ:OLED
ChartMill assigns a proprietary Profitability Rating to each stock. The score is computed by evaluating various profitability ratios and margins and ranges from 0 to 10. NASDAQ:OLED was assigned a score of 9 for profitability:
- Looking at the Return On Assets, with a value of 16.23%, OLED belongs to the top of the industry, outperforming 87.96% of the companies in the same industry.
- Looking at the Return On Equity, with a value of 18.53%, OLED belongs to the top of the industry, outperforming 82.41% of the companies in the same industry.
- The Return On Invested Capital of OLED (15.05%) is better than 87.04% of its industry peers.
- The 3 year average ROIC (13.67%) for OLED is below the current ROIC(15.05%), indicating increased profibility in the last year.
- OLED has a better Profit Margin (36.34%) than 95.37% of its industry peers.
- OLED's Profit Margin has improved in the last couple of years.
- With an excellent Operating Margin value of 38.81%, OLED belongs to the best of the industry, outperforming 96.30% of the companies in the same industry.
- In the last couple of years the Operating Margin of OLED has grown nicely.
- The Gross Margin of OLED (76.77%) is better than 95.37% of its industry peers.
How do we evaluate the setup for NASDAQ:OLED?
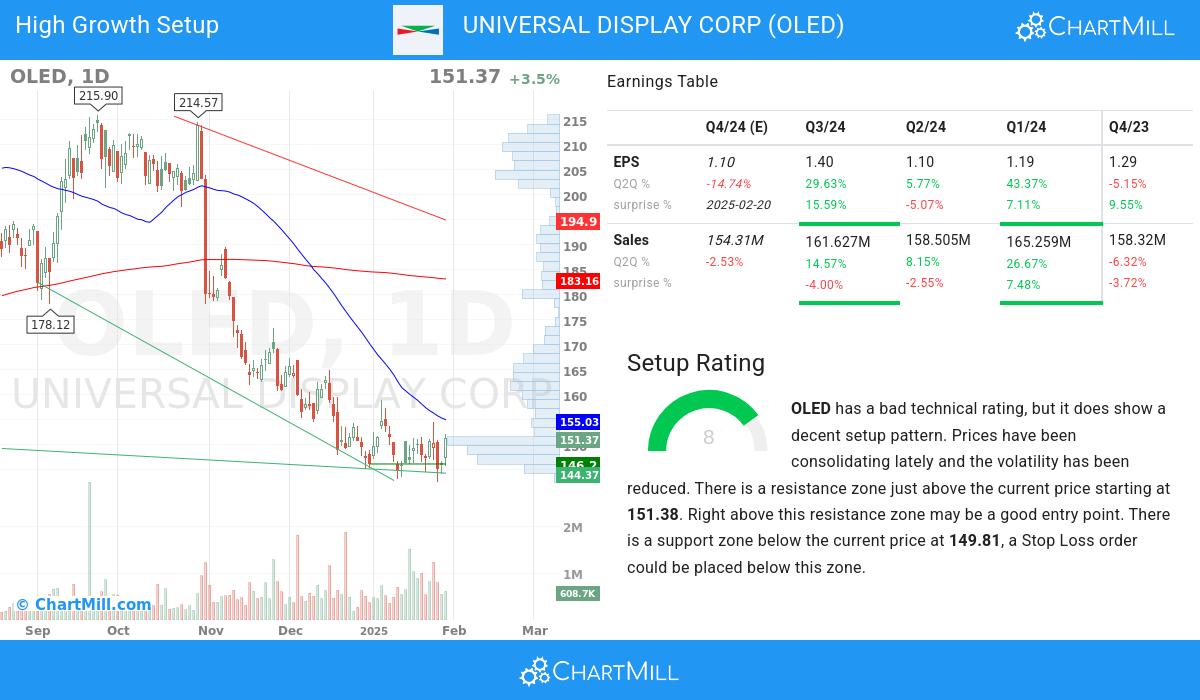
Next to the Technical Rating, the Setup Rating of a stock determines to which extend the stock is consolidating. This score also ranges from 0 to 10 and is updated daily. The setup score evaluates various short term technical indicators. For NASDAQ:OLED this score is currently 8:
Although the technical rating is bad, OLED does present a nice setup opportunity. We see reduced volatility while prices have been consolidating in the most recent period. There is a resistance zone just above the current price starting at 151.38. Right above this resistance zone may be a good entry point. There is a support zone below the current price at 149.81, a Stop Loss order could be placed below this zone.
More Strong Growth stocks can be found in our Strong Growth screener.
For an up to date full fundamental analysis you can check the fundamental report of OLED
For an up to date full technical analysis you can check the technical report of OLED
Disclaimer
Important Note: The content of this article is not intended as trading advice. It is essential to perform your own analysis and exercise caution when making trading decisions. The article presents observations created by automated analysis but does not guarantee any trading or investment outcomes. Always trade responsibly and make independent judgments.
