
NASDAQ:NXT: good value for what you're paying.
By Mill Chart
Last update: Oct 15, 2024
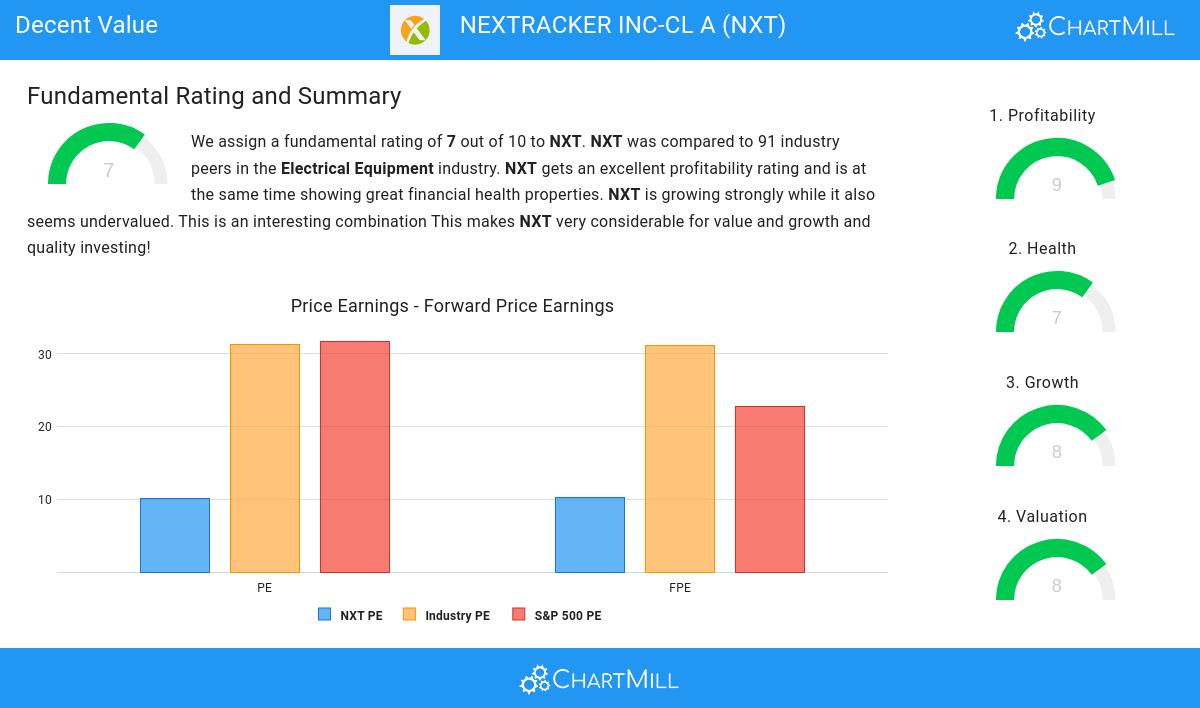
Our stock screening tool has identified NEXTRACKER INC-CL A (NASDAQ:NXT) as an undervalued gem with strong fundamentals. NASDAQ:NXT boasts decent financial health and profitability while maintaining an attractive price point. We'll break it down further.
Understanding NASDAQ:NXT's Valuation
An integral part of ChartMill's stock analysis is the Valuation Rating, which spans from 0 to 10. This rating evaluates diverse valuation factors, including price to earnings and cash flows, while considering the stock's profitability and growth. NASDAQ:NXT has received a 8 out of 10:
- NXT is valuated reasonably with a Price/Earnings ratio of 10.07.
- Based on the Price/Earnings ratio, NXT is valued cheaply inside the industry as 89.89% of the companies are valued more expensively.
- NXT is valuated cheaply when we compare the Price/Earnings ratio to 31.73, which is the current average of the S&P500 Index.
- A Price/Forward Earnings ratio of 10.28 indicates a reasonable valuation of NXT.
- Compared to the rest of the industry, the Price/Forward Earnings ratio of NXT indicates a rather cheap valuation: NXT is cheaper than 87.64% of the companies listed in the same industry.
- NXT is valuated cheaply when we compare the Price/Forward Earnings ratio to 22.71, which is the current average of the S&P500 Index.
- NXT's Enterprise Value to EBITDA ratio is rather cheap when compared to the industry. NXT is cheaper than 94.38% of the companies in the same industry.
- Based on the Price/Free Cash Flow ratio, NXT is valued cheaply inside the industry as 87.64% of the companies are valued more expensively.
- The excellent profitability rating of NXT may justify a higher PE ratio.
How do we evaluate the Profitability for NASDAQ:NXT?
ChartMill utilizes a Profitability Rating to assess stocks, scoring them on a scale of 0 to 10. This rating takes into account a variety of profitability ratios and margins, both in absolute terms and in comparison to industry peers. NASDAQ:NXT has earned a 9 out of 10:
- NXT's Return On Assets of 15.51% is amongst the best of the industry. NXT outperforms 97.75% of its industry peers.
- The Return On Equity of NXT (36.34%) is better than 97.75% of its industry peers.
- The Return On Invested Capital of NXT (28.37%) is better than 98.88% of its industry peers.
- NXT had an Average Return On Invested Capital over the past 3 years of 17.04%. This is significantly above the industry average of 10.94%.
- The last Return On Invested Capital (28.37%) for NXT is above the 3 year average (17.04%), which is a sign of increasing profitability.
- NXT has a better Profit Margin (14.87%) than 94.38% of its industry peers.
- In the last couple of years the Profit Margin of NXT has grown nicely.
- The Operating Margin of NXT (24.63%) is better than 97.75% of its industry peers.
- NXT's Operating Margin has improved in the last couple of years.
- NXT has a Gross Margin of 34.19%. This is in the better half of the industry: NXT outperforms 79.78% of its industry peers.
- NXT's Gross Margin has improved in the last couple of years.
Health Analysis for NASDAQ:NXT
To gauge a stock's financial health, ChartMill utilizes a Health Rating on a scale of 0 to 10. This comprehensive evaluation encompasses liquidity and solvency, both in absolute terms and in comparison to industry peers. NASDAQ:NXT has earned a 7 out of 10:
- NXT has a Altman-Z score of 2.77. This is in the better half of the industry: NXT outperforms 68.54% of its industry peers.
- NXT has a debt to FCF ratio of 0.47. This is a very positive value and a sign of high solvency as it would only need 0.47 years to pay back of all of its debts.
- NXT has a Debt to FCF ratio of 0.47. This is amongst the best in the industry. NXT outperforms 95.51% of its industry peers.
- NXT has a Debt/Equity ratio of 0.13. This is a healthy value indicating a solid balance between debt and equity.
- NXT has a better Debt to Equity ratio (0.13) than 61.80% of its industry peers.
- A Current Ratio of 2.11 indicates that NXT has no problem at all paying its short term obligations.
- With a decent Quick ratio value of 1.91, NXT is doing good in the industry, outperforming 69.66% of the companies in the same industry.
Growth Assessment of NASDAQ:NXT
ChartMill assigns a Growth Rating to every stock. This score ranges from 0 to 10 and evaluates the different growth aspects like EPS and Revenue, both in the past as in the future. NASDAQ:NXT scores a 8 out of 10:
- The Earnings Per Share has grown by an impressive 1129.14% over the past year.
- NXT shows a strong growth in Revenue. In the last year, the Revenue has grown by 38.50%.
- Measured over the past years, NXT shows a very strong growth in Revenue. The Revenue has been growing by 30.49% on average per year.
- NXT is expected to show quite a strong growth in Earnings Per Share. In the coming years, the EPS will grow by 8.73% yearly.
- The Revenue is expected to grow by 10.61% on average over the next years. This is quite good.
- The EPS growth rate is accelerating: in the next years the growth will be better than in the last years.
More Decent Value stocks can be found in our Decent Value screener.
Our latest full fundamental report of NXT contains the most current fundamental analsysis.
Keep in mind
This is not investing advice! The article highlights some of the observations at the time of writing, but you should always make your own analysis and invest based on your own insights.