
Our stock screener has spotted NEXTRACKER INC-CL A (NASDAQ:NXT) as a growth stock which is not overvalued. NASDAQ:NXT is scoring great on several growth aspects while it also shows decent health and profitability. At the same time it remains remains attractively priced. We'll dive into each aspect below.
Assessing Growth for NASDAQ:NXT
ChartMill assigns a Growth Rating to every stock. This score ranges from 0 to 10 and evaluates the different growth aspects like EPS and Revenue, both in the past as in the future. NASDAQ:NXT scores a 8 out of 10:
- NXT shows a strong growth in Earnings Per Share. In the last year, the EPS has been growing by 1129.14%, which is quite impressive.
- Looking at the last year, NXT shows a very strong growth in Revenue. The Revenue has grown by 38.50%.
- The Revenue has been growing by 30.49% on average over the past years. This is a very strong growth!
- The Earnings Per Share is expected to grow by 8.73% on average over the next years. This is quite good.
- NXT is expected to show quite a strong growth in Revenue. In the coming years, the Revenue will grow by 10.61% yearly.
- The EPS growth rate is accelerating: in the next years the growth will be better than in the last years.
How do we evaluate the Valuation for NASDAQ:NXT?
ChartMill assigns a Valuation Rating to each stock, ranging from 0 to 10. This rating is calculated by analyzing different valuation elements, such as price to earnings and free cash flow, both in absolute terms and relative to the market and industry. In the case of NASDAQ:NXT, the assigned 8 reflects its valuation:
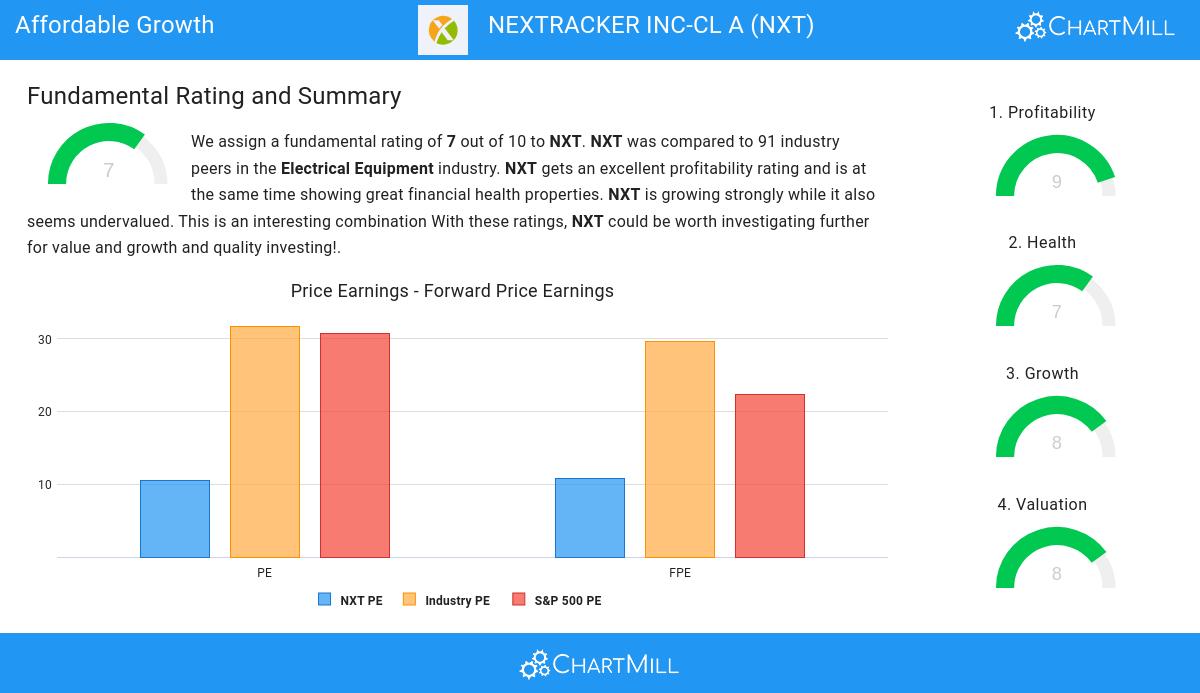
- NXT is valuated reasonably with a Price/Earnings ratio of 10.53.
- Compared to the rest of the industry, the Price/Earnings ratio of NXT indicates a rather cheap valuation: NXT is cheaper than 88.76% of the companies listed in the same industry.
- NXT's Price/Earnings ratio indicates a rather cheap valuation when compared to the S&P500 average which is at 30.69.
- Based on the Price/Forward Earnings ratio of 10.76, the valuation of NXT can be described as reasonable.
- 88.76% of the companies in the same industry are more expensive than NXT, based on the Price/Forward Earnings ratio.
- Compared to an average S&P500 Price/Forward Earnings ratio of 22.27, NXT is valued rather cheaply.
- Compared to the rest of the industry, the Enterprise Value to EBITDA ratio of NXT indicates a rather cheap valuation: NXT is cheaper than 93.26% of the companies listed in the same industry.
- 85.39% of the companies in the same industry are more expensive than NXT, based on the Price/Free Cash Flow ratio.
- The excellent profitability rating of NXT may justify a higher PE ratio.
Unpacking NASDAQ:NXT's Health Rating
ChartMill employs its own Health Rating for stock assessment. This rating, ranging from 0 to 10, is calculated by examining various liquidity and solvency ratios. In the case of NASDAQ:NXT, the assigned 7 reflects its health status:
- NXT has a Altman-Z score of 2.86. This is in the better half of the industry: NXT outperforms 66.29% of its industry peers.
- NXT has a debt to FCF ratio of 0.47. This is a very positive value and a sign of high solvency as it would only need 0.47 years to pay back of all of its debts.
- With an excellent Debt to FCF ratio value of 0.47, NXT belongs to the best of the industry, outperforming 95.51% of the companies in the same industry.
- A Debt/Equity ratio of 0.13 indicates that NXT is not too dependend on debt financing.
- NXT has a Debt to Equity ratio of 0.13. This is in the better half of the industry: NXT outperforms 60.67% of its industry peers.
- NXT has a Current Ratio of 2.11. This indicates that NXT is financially healthy and has no problem in meeting its short term obligations.
- NXT has a Quick ratio of 1.91. This is in the better half of the industry: NXT outperforms 69.66% of its industry peers.
Evaluating Profitability: NASDAQ:NXT
Discover ChartMill's exclusive Profitability Rating, a proprietary metric that assesses stocks on a scale of 0 to 10. It takes into consideration various profitability ratios and margins, both in absolute terms and relative to industry peers. Notably, NASDAQ:NXT has achieved a 9:
- NXT has a better Return On Assets (15.51%) than 97.75% of its industry peers.
- NXT has a better Return On Equity (36.34%) than 97.75% of its industry peers.
- NXT has a Return On Invested Capital of 28.37%. This is amongst the best in the industry. NXT outperforms 98.88% of its industry peers.
- Measured over the past 3 years, the Average Return On Invested Capital for NXT is significantly above the industry average of 10.93%.
- The last Return On Invested Capital (28.37%) for NXT is above the 3 year average (17.04%), which is a sign of increasing profitability.
- NXT has a Profit Margin of 14.87%. This is amongst the best in the industry. NXT outperforms 94.38% of its industry peers.
- NXT's Profit Margin has improved in the last couple of years.
- NXT has a better Operating Margin (24.63%) than 97.75% of its industry peers.
- NXT's Operating Margin has improved in the last couple of years.
- NXT has a better Gross Margin (34.19%) than 79.78% of its industry peers.
- In the last couple of years the Gross Margin of NXT has grown nicely.
More Affordable Growth stocks can be found in our Affordable Growth screener.
For an up to date full fundamental analysis you can check the fundamental report of NXT
Disclaimer
This is not investing advice! The article highlights some of the observations at the time of writing, but you should always make your own analysis and invest based on your own insights.
