
Looking for growth without the hefty price tag? Consider NASDAQ:NXT.
By Mill Chart
Last update: Sep 3, 2024
Consider NEXTRACKER INC-CL A (NASDAQ:NXT) as an affordable growth stock, identified by our stock screening tool. NASDAQ:NXT is showcasing impressive growth figures and is well-positioned in terms of profitability, solvency, and liquidity. Moreover, it seems to be priced reasonably. Let's dive deeper into the analysis.
Understanding NASDAQ:NXT's Growth Score
A key component of ChartMill's stock assessment is the Growth Rating, which spans from 0 to 10. This rating evaluates diverse growth factors, such as EPS and revenue growth, considering both past performance and future projections. NASDAQ:NXT has received a 8 out of 10:
- NXT shows a strong growth in Earnings Per Share. In the last year, the EPS has been growing by 1129.14%, which is quite impressive.
- NXT shows a strong growth in Revenue. In the last year, the Revenue has grown by 38.50%.
- NXT shows a strong growth in Revenue. Measured over the last years, the Revenue has been growing by 30.49% yearly.
- NXT is expected to show quite a strong growth in Earnings Per Share. In the coming years, the EPS will grow by 8.73% yearly.
- The Revenue is expected to grow by 10.61% on average over the next years. This is quite good.
- The EPS growth rate is accelerating: in the next years the growth will be better than in the last years.
ChartMill's Evaluation of Valuation
ChartMill provides a Valuation Rating to every stock, ranging from 0 to 10. This rating assesses various valuation aspects, comparing price to earnings and cash flows, while considering factors like profitability and growth. NASDAQ:NXT boasts a 7 out of 10:
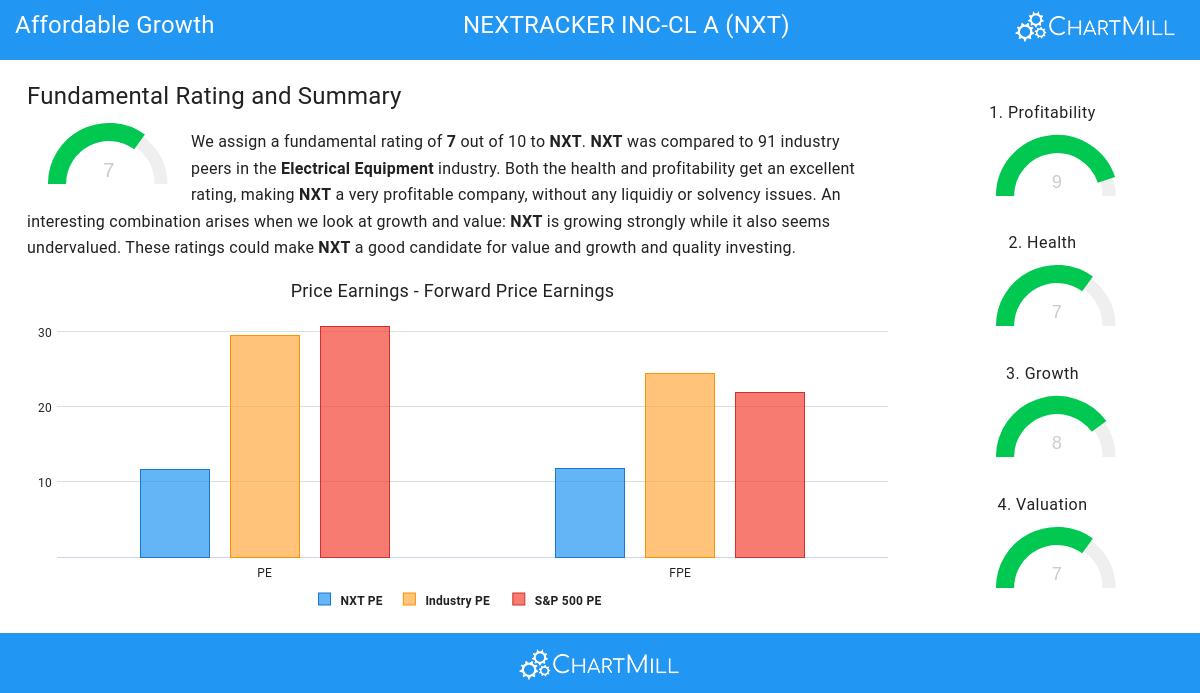
- A Price/Earnings ratio of 11.62 indicates a reasonable valuation of NXT.
- Based on the Price/Earnings ratio, NXT is valued cheaper than 87.78% of the companies in the same industry.
- NXT's Price/Earnings ratio indicates a rather cheap valuation when compared to the S&P500 average which is at 30.73.
- NXT is valuated reasonably with a Price/Forward Earnings ratio of 11.84.
- NXT's Price/Forward Earnings ratio is rather cheap when compared to the industry. NXT is cheaper than 86.67% of the companies in the same industry.
- Compared to an average S&P500 Price/Forward Earnings ratio of 21.86, NXT is valued a bit cheaper.
- Based on the Enterprise Value to EBITDA ratio, NXT is valued cheaply inside the industry as 92.22% of the companies are valued more expensively.
- NXT's Price/Free Cash Flow ratio is rather cheap when compared to the industry. NXT is cheaper than 84.44% of the companies in the same industry.
- The excellent profitability rating of NXT may justify a higher PE ratio.
A Closer Look at Health for NASDAQ:NXT
ChartMill employs a unique Health Rating system for all stocks. This rating, ranging from 0 to 10, is determined by analyzing various liquidity and solvency ratios. For NASDAQ:NXT, the assigned 7 for health provides valuable insights:
- An Altman-Z score of 3.08 indicates that NXT is not in any danger for bankruptcy at the moment.
- The Altman-Z score of NXT (3.08) is better than 67.78% of its industry peers.
- NXT has a debt to FCF ratio of 0.47. This is a very positive value and a sign of high solvency as it would only need 0.47 years to pay back of all of its debts.
- NXT has a Debt to FCF ratio of 0.47. This is amongst the best in the industry. NXT outperforms 94.44% of its industry peers.
- A Debt/Equity ratio of 0.13 indicates that NXT is not too dependend on debt financing.
- A Current Ratio of 2.11 indicates that NXT has no problem at all paying its short term obligations.
- NXT's Quick ratio of 1.91 is fine compared to the rest of the industry. NXT outperforms 71.11% of its industry peers.
Profitability Examination for NASDAQ:NXT
ChartMill assigns a proprietary Profitability Rating to each stock. The score is computed by evaluating various profitability ratios and margins and ranges from 0 to 10. NASDAQ:NXT was assigned a score of 9 for profitability:
- Looking at the Return On Assets, with a value of 15.51%, NXT belongs to the top of the industry, outperforming 96.67% of the companies in the same industry.
- NXT has a Return On Equity of 36.34%. This is amongst the best in the industry. NXT outperforms 97.78% of its industry peers.
- The Return On Invested Capital of NXT (28.37%) is better than 98.89% of its industry peers.
- Measured over the past 3 years, the Average Return On Invested Capital for NXT is significantly above the industry average of 10.97%.
- The last Return On Invested Capital (28.37%) for NXT is above the 3 year average (17.04%), which is a sign of increasing profitability.
- With an excellent Profit Margin value of 14.87%, NXT belongs to the best of the industry, outperforming 94.44% of the companies in the same industry.
- NXT's Profit Margin has improved in the last couple of years.
- NXT has a better Operating Margin (24.63%) than 97.78% of its industry peers.
- In the last couple of years the Operating Margin of NXT has grown nicely.
- The Gross Margin of NXT (34.19%) is better than 80.00% of its industry peers.
- NXT's Gross Margin has improved in the last couple of years.
Our Affordable Growth screener lists more Affordable Growth stocks and is updated daily.
Our latest full fundamental report of NXT contains the most current fundamental analsysis.
Keep in mind
This article should in no way be interpreted as advice. The article is based on the observed metrics at the time of writing, but you should always make your own analysis and trade or invest at your own responsibility.