
Why NASDAQ:NXT Is a Promising High-Growth Stock in the Midst of Consolidation.
By Mill Chart
Last update: Sep 2, 2024
Growth investors are on the lookout for stocks displaying robust revenue and EPS growth. In this analysis, we'll assess whether NEXTRACKER INC-CL A (NASDAQ:NXT) aligns with growth investing criteria, especially as it consolidates and signals a possible breakout. As always, investors should conduct their own research, but NEXTRACKER INC-CL A has surfaced on our radar for growth with base formation, warranting further examination.
Evaluating Growth: NASDAQ:NXT
To evaluate a stock's growth potential, ChartMill utilizes a Growth Rating on a scale of 0 to 10. This comprehensive assessment considers various growth aspects, including historical and estimated EPS and revenue growth. NASDAQ:NXT has achieved a 8 out of 10:
- NXT shows a strong growth in Earnings Per Share. In the last year, the EPS has been growing by 1129.14%, which is quite impressive.
- The Revenue has grown by 38.50% in the past year. This is a very strong growth!
- The Revenue has been growing by 30.49% on average over the past years. This is a very strong growth!
- NXT is expected to show quite a strong growth in Earnings Per Share. In the coming years, the EPS will grow by 8.73% yearly.
- NXT is expected to show quite a strong growth in Revenue. In the coming years, the Revenue will grow by 10.61% yearly.
- When comparing the EPS growth rate of the last years to the growth rate of the upcoming years, we see that the growth is accelerating.
Evaluating Health: NASDAQ:NXT
ChartMill utilizes a Health Rating to assess stocks, scoring them on a scale of 0 to 10. This rating takes into account a variety of liquidity and solvency ratios, both in absolute terms and in comparison to industry peers. NASDAQ:NXT has earned a 7 out of 10:
- An Altman-Z score of 3.08 indicates that NXT is not in any danger for bankruptcy at the moment.
- NXT has a better Altman-Z score (3.08) than 67.78% of its industry peers.
- NXT has a debt to FCF ratio of 0.47. This is a very positive value and a sign of high solvency as it would only need 0.47 years to pay back of all of its debts.
- Looking at the Debt to FCF ratio, with a value of 0.47, NXT belongs to the top of the industry, outperforming 94.44% of the companies in the same industry.
- A Debt/Equity ratio of 0.13 indicates that NXT is not too dependend on debt financing.
- NXT has a Current Ratio of 2.11. This indicates that NXT is financially healthy and has no problem in meeting its short term obligations.
- NXT has a better Quick ratio (1.91) than 71.11% of its industry peers.
Assessing Profitability for NASDAQ:NXT
ChartMill assigns a Profitability Rating to every stock. This score ranges from 0 to 10 and evaluates the different profitability ratios and margins, both absolutely, but also relative to the industry peers. NASDAQ:NXT scores a 9 out of 10:
- NXT has a Return On Assets of 15.51%. This is amongst the best in the industry. NXT outperforms 96.67% of its industry peers.
- With an excellent Return On Equity value of 36.34%, NXT belongs to the best of the industry, outperforming 97.78% of the companies in the same industry.
- Looking at the Return On Invested Capital, with a value of 28.37%, NXT belongs to the top of the industry, outperforming 98.89% of the companies in the same industry.
- The Average Return On Invested Capital over the past 3 years for NXT is significantly above the industry average of 10.97%.
- The 3 year average ROIC (17.04%) for NXT is below the current ROIC(28.37%), indicating increased profibility in the last year.
- With an excellent Profit Margin value of 14.87%, NXT belongs to the best of the industry, outperforming 94.44% of the companies in the same industry.
- In the last couple of years the Profit Margin of NXT has grown nicely.
- NXT's Operating Margin of 24.63% is amongst the best of the industry. NXT outperforms 97.78% of its industry peers.
- NXT's Operating Margin has improved in the last couple of years.
- NXT's Gross Margin of 34.19% is fine compared to the rest of the industry. NXT outperforms 80.00% of its industry peers.
- In the last couple of years the Gross Margin of NXT has grown nicely.
How do we evaluate the setup for NASDAQ:NXT?
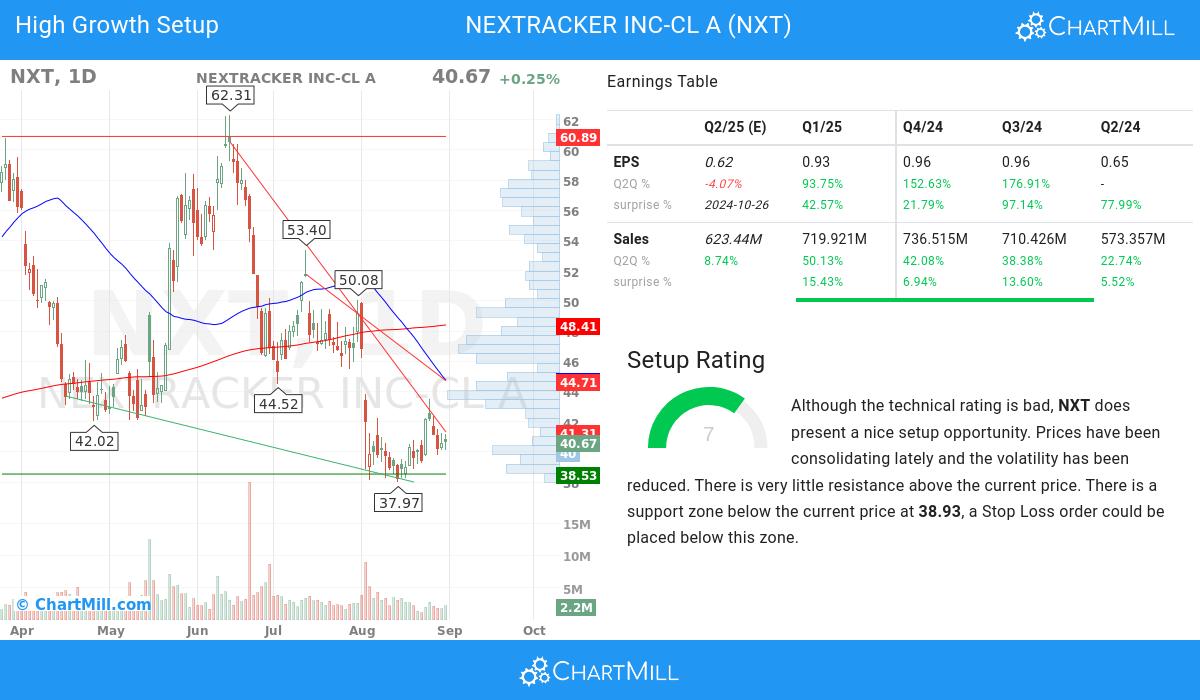
ChartMill takes into account not only the Technical Rating but also assigns a Setup Rating to each stock. This rating, on a scale of 0 to 10, reflects the degree of consolidation observed based on short-term technical indicators. Currently, NASDAQ:NXT exhibits a 7 setup rating, indicating its consolidation status in recent days and weeks.
NXT has a bad technical rating, but it does show a decent setup pattern. We see reduced volatility while prices have been consolidating in the most recent period. There is very little resistance above the current price. There is a support zone below the current price at 38.93, a Stop Loss order could be placed below this zone.
Every day, new Strong Growth stocks can be found on ChartMill in our Strong Growth screener.
Our latest full fundamental report of NXT contains the most current fundamental analsysis.
Check the latest full technical report of NXT for a complete technical analysis.
Keep in mind
Important Note: The content of this article is not intended as trading advice. It is essential to perform your own analysis and exercise caution when making trading decisions. The article presents observations created by automated analysis but does not guarantee any trading or investment outcomes. Always trade responsibly and make independent judgments.