
NASDAQ:NXPI is an undervalued gem with solid fundamentals.
By Mill Chart
Last update: Feb 4, 2025
Discover NXP SEMICONDUCTORS NV (NASDAQ:NXPI), an undervalued stock highlighted by our stock screener. NASDAQ:NXPI showcases solid financial health and profitability while maintaining an appealing valuation. We'll explore the details.
A Closer Look at Valuation for NASDAQ:NXPI
ChartMill employs its own Valuation Rating system for all stocks. This score, ranging from 0 to 10, is determined by evaluating different valuation factors, including price to earnings and free cash flow, both in absolute terms and relative to the market and industry. NASDAQ:NXPI has earned a 7 for valuation:
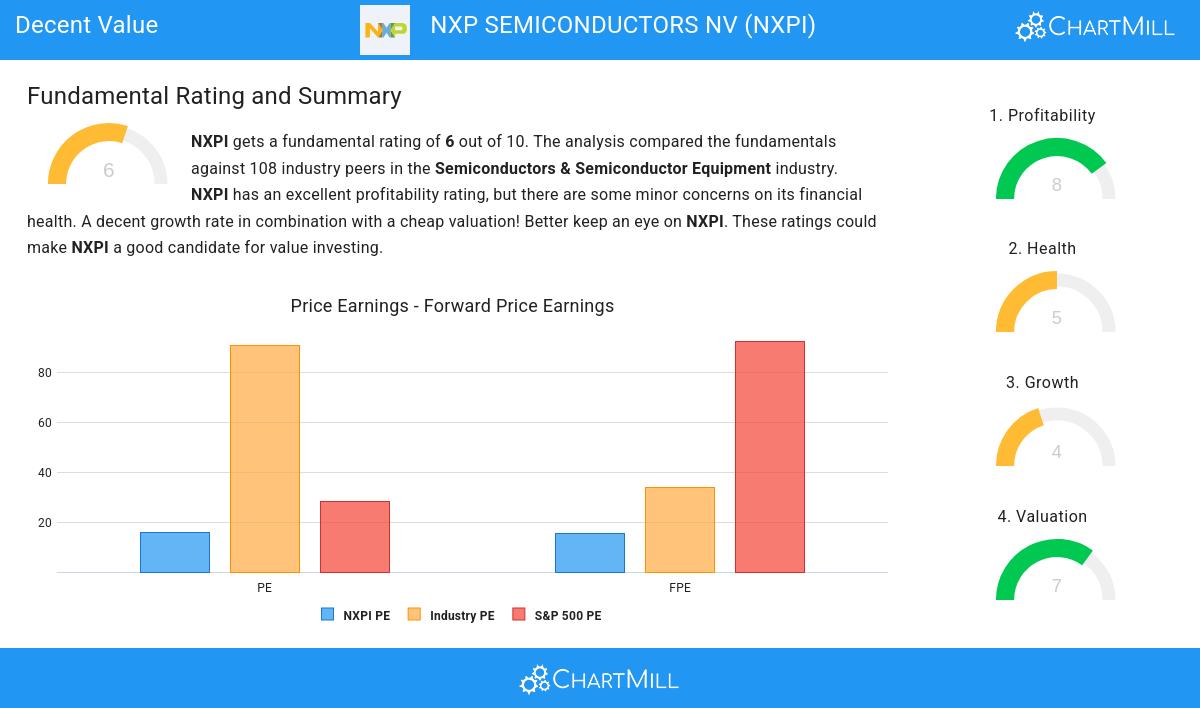
- 85.19% of the companies in the same industry are more expensive than NXPI, based on the Price/Earnings ratio.
- When comparing the Price/Earnings ratio of NXPI to the average of the S&P500 Index (28.36), we can say NXPI is valued slightly cheaper.
- 84.26% of the companies in the same industry are more expensive than NXPI, based on the Price/Forward Earnings ratio.
- Compared to an average S&P500 Price/Forward Earnings ratio of 92.49, NXPI is valued rather cheaply.
- 81.48% of the companies in the same industry are more expensive than NXPI, based on the Enterprise Value to EBITDA ratio.
- Based on the Price/Free Cash Flow ratio, NXPI is valued cheaper than 86.11% of the companies in the same industry.
- The excellent profitability rating of NXPI may justify a higher PE ratio.
- NXPI's earnings are expected to grow with 12.84% in the coming years. This may justify a more expensive valuation.
Understanding NASDAQ:NXPI's Profitability
ChartMill assigns a Profitability Rating to every stock. This score ranges from 0 to 10 and evaluates the different profitability ratios and margins, both absolutely, but also relative to the industry peers. NASDAQ:NXPI scores a 8 out of 10:
- Looking at the Return On Assets, with a value of 11.46%, NXPI is in the better half of the industry, outperforming 76.85% of the companies in the same industry.
- Looking at the Return On Equity, with a value of 28.83%, NXPI belongs to the top of the industry, outperforming 90.74% of the companies in the same industry.
- NXPI has a better Return On Invested Capital (15.28%) than 87.96% of its industry peers.
- NXPI had an Average Return On Invested Capital over the past 3 years of 14.52%. This is above the industry average of 11.99%.
- The 3 year average ROIC (14.52%) for NXPI is below the current ROIC(15.28%), indicating increased profibility in the last year.
- NXPI has a Profit Margin of 20.98%. This is amongst the best in the industry. NXPI outperforms 80.56% of its industry peers.
- The Operating Margin of NXPI (28.98%) is better than 89.81% of its industry peers.
- NXPI's Operating Margin has improved in the last couple of years.
- NXPI has a better Gross Margin (57.24%) than 79.63% of its industry peers.
- In the last couple of years the Gross Margin of NXPI has grown nicely.
Understanding NASDAQ:NXPI's Health
To gauge a stock's financial health, ChartMill utilizes a Health Rating on a scale of 0 to 10. This comprehensive evaluation encompasses liquidity and solvency, both in absolute terms and in comparison to industry peers. NASDAQ:NXPI has earned a 5 out of 10:
- An Altman-Z score of 3.37 indicates that NXPI is not in any danger for bankruptcy at the moment.
- NXPI has a debt to FCF ratio of 3.92. This is a good value and a sign of high solvency as NXPI would need 3.92 years to pay back of all of its debts.
- The Debt to FCF ratio of NXPI (3.92) is better than 61.11% of its industry peers.
- NXPI has a Current Ratio of 2.35. This indicates that NXPI is financially healthy and has no problem in meeting its short term obligations.
Looking at the Growth
A key component of ChartMill's stock assessment is the Growth Rating, which spans from 0 to 10. This rating evaluates diverse growth factors, such as EPS and revenue growth, considering both past performance and future projections. NASDAQ:NXPI has received a 4 out of 10:
- Measured over the past years, NXPI shows a quite strong growth in Earnings Per Share. The EPS has been growing by 11.51% on average per year.
- NXPI is expected to show quite a strong growth in Earnings Per Share. In the coming years, the EPS will grow by 16.24% yearly.
- NXPI is expected to show quite a strong growth in Revenue. In the coming years, the Revenue will grow by 9.59% yearly.
- The EPS growth rate is accelerating: in the next years the growth will be better than in the last years.
Our Decent Value screener lists more Decent Value stocks and is updated daily.
Our latest full fundamental report of NXPI contains the most current fundamental analsysis.
Disclaimer
This is not investing advice! The article highlights some of the observations at the time of writing, but you should always make your own analysis and invest based on your own insights.