
NOVARTIS AG-SPONSORED ADR (NYSE:NVS) is an undervalued gem with solid fundamentals.
By Mill Chart
Last update: Mar 26, 2025
Discover NOVARTIS AG-SPONSORED ADR (NYSE:NVS), an undervalued stock highlighted by our stock screener. NVS showcases solid financial health and profitability while maintaining an appealing valuation. We'll explore the details.
Assessing Valuation Metrics for NVS
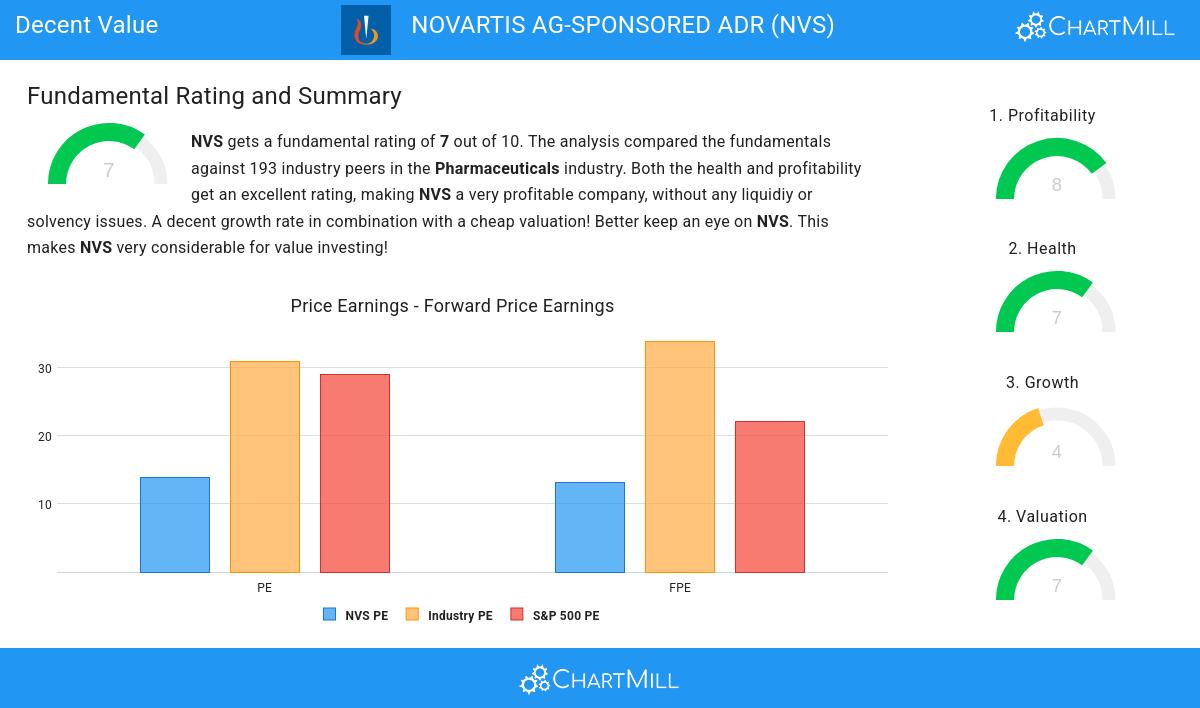
ChartMill employs its own Valuation Rating system for all stocks. This score, ranging from 0 to 10, is determined by evaluating different valuation factors, including price to earnings and free cash flow, both in absolute terms and relative to the market and industry. NVS has earned a 7 for valuation:
- Based on the Price/Earnings ratio, NVS is valued cheaply inside the industry as 87.05% of the companies are valued more expensively.
- The average S&P500 Price/Earnings ratio is at 29.07. NVS is valued rather cheaply when compared to this.
- Based on the Price/Forward Earnings ratio, NVS is valued cheaply inside the industry as 83.94% of the companies are valued more expensively.
- Compared to an average S&P500 Price/Forward Earnings ratio of 22.05, NVS is valued a bit cheaper.
- Compared to the rest of the industry, the Enterprise Value to EBITDA ratio of NVS indicates a rather cheap valuation: NVS is cheaper than 82.90% of the companies listed in the same industry.
- Compared to the rest of the industry, the Price/Free Cash Flow ratio of NVS indicates a rather cheap valuation: NVS is cheaper than 87.56% of the companies listed in the same industry.
- The excellent profitability rating of NVS may justify a higher PE ratio.
Analyzing Profitability Metrics
ChartMill assigns a Profitability Rating to every stock. This score ranges from 0 to 10 and evaluates the different profitability ratios and margins, both absolutely, but also relative to the industry peers. NVS scores a 8 out of 10:
- NVS's Return On Assets of 12.25% is amongst the best of the industry. NVS outperforms 94.30% of its industry peers.
- NVS has a Return On Equity of 28.61%. This is amongst the best in the industry. NVS outperforms 95.85% of its industry peers.
- NVS has a better Return On Invested Capital (21.20%) than 95.34% of its industry peers.
- The last Return On Invested Capital (21.20%) for NVS is above the 3 year average (14.58%), which is a sign of increasing profitability.
- NVS has a Profit Margin of 23.09%. This is amongst the best in the industry. NVS outperforms 93.78% of its industry peers.
- With an excellent Operating Margin value of 31.57%, NVS belongs to the best of the industry, outperforming 94.82% of the companies in the same industry.
- In the last couple of years the Operating Margin of NVS has grown nicely.
- With an excellent Gross Margin value of 75.22%, NVS belongs to the best of the industry, outperforming 81.35% of the companies in the same industry.
Health Insights: NVS
ChartMill assigns a Health Rating to every stock. This score ranges from 0 to 10 and evaluates the different health aspects like liquidity and solvency, both absolutely, but also relative to the industry peers. NVS scores a 7 out of 10:
- NVS has an Altman-Z score of 3.99. This indicates that NVS is financially healthy and has little risk of bankruptcy at the moment.
- NVS has a better Altman-Z score (3.99) than 79.27% of its industry peers.
- NVS has a debt to FCF ratio of 2.10. This is a good value and a sign of high solvency as NVS would need 2.10 years to pay back of all of its debts.
- NVS's Debt to FCF ratio of 2.10 is amongst the best of the industry. NVS outperforms 93.78% of its industry peers.
- Although NVS does not score too well on debt/equity it has very limited outstanding debt, which is well covered by the FCF. We will not put too much weight on the debt/equity number as it may be because of low equity, which could be a consequence of a share buyback program for instance. This needs to be investigated.
- NVS does not score too well on the current and quick ratio evaluation. However, as it has excellent solvency and profitability, these ratios do not necessarly indicate liquidity issues and need to be evaluated against the specifics of the business.
Evaluating Growth: NVS
To evaluate a stock's growth potential, ChartMill utilizes a Growth Rating on a scale of 0 to 10. This comprehensive assessment considers various growth aspects, including historical and estimated EPS and revenue growth. NVS has achieved a 4 out of 10:
- The Earnings Per Share has grown by an nice 13.19% over the past year.
- NVS shows quite a strong growth in Earnings Per Share. Measured over the last years, the EPS has been growing by 8.14% yearly.
- When comparing the Revenue growth rate of the last years to the growth rate of the upcoming years, we see that the growth is accelerating.
More Decent Value stocks can be found in our Decent Value screener.
Check the latest full fundamental report of NVS for a complete fundamental analysis.
Keep in mind
This article should in no way be interpreted as advice. The article is based on the observed metrics at the time of writing, but you should always make your own analysis and trade or invest at your own responsibility.
110.86
+1.28 (+1.17%)
Find more stocks in the Stock Screener
NVS Latest News and Analysis
 20 days ago - ChartmillNOVARTIS AG-SPONSORED ADR (NYSE:NVS) Technical Analysis observations.
Exploring NOVARTIS AG-SPONSORED ADR's Technical Signals and Breakout Potential: Promising Signs: NOVARTIS AG-SPONSORED ADR Setting the Stage for a Breakout.
