
Why NYSE:NVS is a Top Pick for Dividend Investors.
By Mill Chart
Last update: Oct 9, 2024
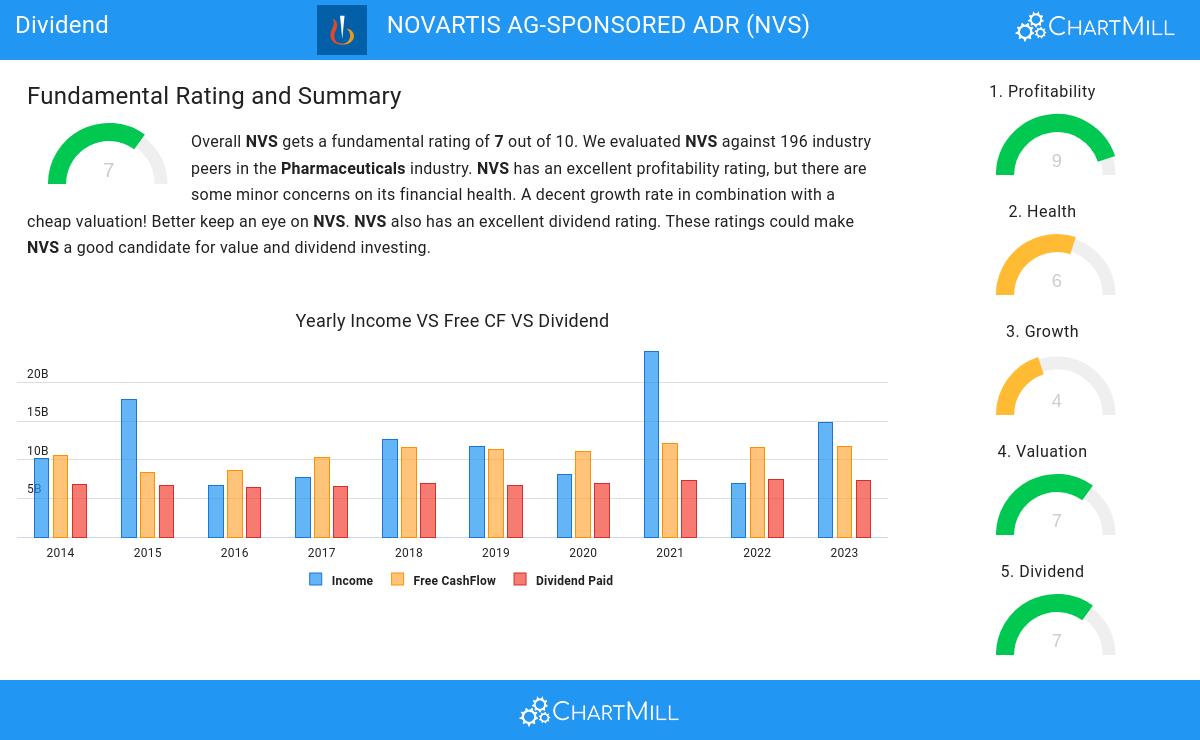
Our stock screener has spotted NOVARTIS AG-SPONSORED ADR (NYSE:NVS) as a good dividend stock with solid fundamentals. NYSE:NVS shows decent health and profitability. At the same time it gives a good and sustainable dividend. We'll dive into each aspect below.
Dividend Analysis for NYSE:NVS
ChartMill assigns a Dividend Rating to each stock, ranging from 0 to 10. This rating is calculated by analyzing various dividend elements, such as yield, historical performance, dividend growth, and sustainability. NYSE:NVS has been awarded a 7 for its dividend quality:
- Compared to an average industry Dividend Yield of 4.07, NVS pays a better dividend. On top of this NVS pays more dividend than 94.30% of the companies listed in the same industry.
- Compared to an average S&P500 Dividend Yield of 2.22, NVS pays a better dividend.
- NVS has been paying a dividend for at least 10 years, so it has a reliable track record.
- 29.69% of the earnings are spent on dividend by NVS. This is a low number and sustainable payout ratio.
- The dividend of NVS is growing, but earnings are growing more, so the dividend growth is sustainable.
Evaluating Health: NYSE:NVS
ChartMill employs its own Health Rating for stock assessment. This rating, ranging from 0 to 10, is calculated by examining various liquidity and solvency ratios. In the case of NYSE:NVS, the assigned 6 reflects its health status:
- NVS has an Altman-Z score of 4.27. This indicates that NVS is financially healthy and has little risk of bankruptcy at the moment.
- Looking at the Altman-Z score, with a value of 4.27, NVS is in the better half of the industry, outperforming 76.68% of the companies in the same industry.
- NVS has a debt to FCF ratio of 2.63. This is a good value and a sign of high solvency as NVS would need 2.63 years to pay back of all of its debts.
- NVS has a Debt to FCF ratio of 2.63. This is amongst the best in the industry. NVS outperforms 93.26% of its industry peers.
- NVS has a Debt/Equity ratio of 0.47. This is a healthy value indicating a solid balance between debt and equity.
- The current and quick ratio evaluation for NVS is rather negative, while it does have excellent solvency and profitability. These ratios do not necessarly indicate liquidity issues and need to be evaluated against the specifics of the business.
Profitability Assessment of NYSE:NVS
Discover ChartMill's exclusive Profitability Rating, a proprietary metric that assesses stocks on a scale of 0 to 10. It takes into consideration various profitability ratios and margins, both in absolute terms and relative to industry peers. Notably, NYSE:NVS has achieved a 9:
- NVS has a Return On Assets of 18.59%. This is amongst the best in the industry. NVS outperforms 97.41% of its industry peers.
- The Return On Equity of NVS (44.20%) is better than 95.34% of its industry peers.
- NVS has a Return On Invested Capital of 22.45%. This is amongst the best in the industry. NVS outperforms 96.89% of its industry peers.
- The last Return On Invested Capital (22.45%) for NVS is above the 3 year average (11.23%), which is a sign of increasing profitability.
- NVS has a better Profit Margin (29.84%) than 95.34% of its industry peers.
- NVS's Profit Margin has improved in the last couple of years.
- NVS has a Operating Margin of 27.87%. This is amongst the best in the industry. NVS outperforms 92.75% of its industry peers.
- In the last couple of years the Operating Margin of NVS has grown nicely.
- NVS has a better Gross Margin (74.29%) than 82.38% of its industry peers.
Our Best Dividend screener lists more Best Dividend stocks and is updated daily.
Check the latest full fundamental report of NVS for a complete fundamental analysis.
Disclaimer
Important Note: The content of this article is not intended as trading advice. It is essential to perform your own analysis and exercise caution when making trading decisions. The article presents observations created by automated analysis but does not guarantee any trading or investment outcomes. Always trade responsibly and make independent judgments.
110.86
+1.28 (+1.17%)
Find more stocks in the Stock Screener
NVS Latest News and Analysis
 20 days ago - ChartmillNOVARTIS AG-SPONSORED ADR (NYSE:NVS) Technical Analysis observations.
Exploring NOVARTIS AG-SPONSORED ADR's Technical Signals and Breakout Potential: Promising Signs: NOVARTIS AG-SPONSORED ADR Setting the Stage for a Breakout.
