
Balancing Dividends and Fundamentals: The Case of NYSE:NVS.
By Mill Chart
Last update: Sep 13, 2024
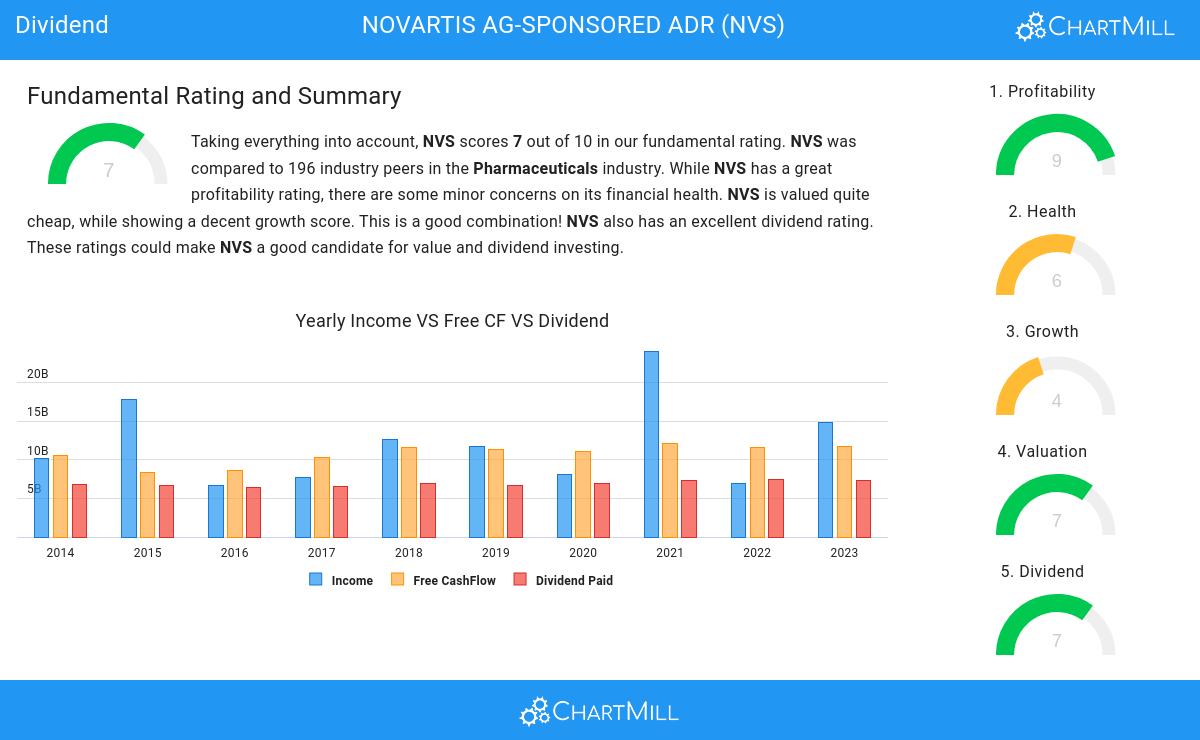
Our stock screener has spotted NOVARTIS AG-SPONSORED ADR (NYSE:NVS) as a good dividend stock with solid fundamentals. NYSE:NVS shows decent health and profitability. At the same time it gives a good and sustainable dividend. We'll dive into each aspect below.
Dividend Analysis for NYSE:NVS
ChartMill employs its own Dividend Rating system for all stocks. This score, on a scale of 0 to 10, is determined by evaluating different dividend factors, such as yield, historical performance, dividend growth, and sustainability. NYSE:NVS has been assigned a 7 for dividend:
- NVS's Dividend Yield is rather good when compared to the industry average which is at 3.94. NVS pays more dividend than 94.36% of the companies in the same industry.
- Compared to an average S&P500 Dividend Yield of 2.26, NVS pays a bit more dividend than the S&P500 average.
- NVS has been paying a dividend for at least 10 years, so it has a reliable track record.
- NVS pays out 29.69% of its income as dividend. This is a sustainable payout ratio.
- The dividend of NVS is growing, but earnings are growing more, so the dividend growth is sustainable.
Health Insights: NYSE:NVS
ChartMill employs its own Health Rating for stock assessment. This rating, ranging from 0 to 10, is calculated by examining various liquidity and solvency ratios. In the case of NYSE:NVS, the assigned 6 reflects its health status:
- An Altman-Z score of 4.33 indicates that NVS is not in any danger for bankruptcy at the moment.
- NVS has a Altman-Z score of 4.33. This is in the better half of the industry: NVS outperforms 78.46% of its industry peers.
- NVS has a debt to FCF ratio of 2.63. This is a good value and a sign of high solvency as NVS would need 2.63 years to pay back of all of its debts.
- Looking at the Debt to FCF ratio, with a value of 2.63, NVS belongs to the top of the industry, outperforming 93.33% of the companies in the same industry.
- NVS has a Debt/Equity ratio of 0.47. This is a healthy value indicating a solid balance between debt and equity.
- The current and quick ratio evaluation for NVS is rather negative, while it does have excellent solvency and profitability. These ratios do not necessarly indicate liquidity issues and need to be evaluated against the specifics of the business.
Profitability Analysis for NYSE:NVS
ChartMill assigns a proprietary Profitability Rating to each stock. The score is computed by evaluating various profitability ratios and margins and ranges from 0 to 10. NYSE:NVS was assigned a score of 9 for profitability:
- NVS has a better Return On Assets (18.59%) than 97.44% of its industry peers.
- NVS has a better Return On Equity (44.20%) than 95.38% of its industry peers.
- NVS's Return On Invested Capital of 22.45% is amongst the best of the industry. NVS outperforms 96.92% of its industry peers.
- The last Return On Invested Capital (22.45%) for NVS is above the 3 year average (11.23%), which is a sign of increasing profitability.
- NVS's Profit Margin of 29.84% is amongst the best of the industry. NVS outperforms 95.38% of its industry peers.
- In the last couple of years the Profit Margin of NVS has grown nicely.
- Looking at the Operating Margin, with a value of 27.87%, NVS belongs to the top of the industry, outperforming 92.82% of the companies in the same industry.
- NVS's Operating Margin has improved in the last couple of years.
- NVS has a Gross Margin of 74.29%. This is amongst the best in the industry. NVS outperforms 81.54% of its industry peers.
Our Best Dividend screener lists more Best Dividend stocks and is updated daily.
Our latest full fundamental report of NVS contains the most current fundamental analsysis.
Keep in mind
This is not investing advice! The article highlights some of the observations at the time of writing, but you should always make your own analysis and invest based on your own insights.