
NOVO-NORDISK A/S-SPONS ADR (NYSE:NVO) was identified as an affordable growth stock by our stock screener. NYSE:NVO is showing great growth, but also scores well on profitability, solvency and liquidity. At the same time it seems to be priced reasonably. We'll explore this a bit deeper below.
Evaluating Growth: NYSE:NVO
ChartMill employs its own Growth Rating system for all stocks. This score, ranging from 0 to 10, is derived by evaluating different growth factors, such as EPS and revenue growth, taking into account both past performance and future projections. NYSE:NVO has earned a 7 for growth:
- NVO shows a strong growth in Earnings Per Share. In the last year, the EPS has been growing by 34.90%, which is quite impressive.
- NVO shows a strong growth in Revenue. In the last year, the Revenue has grown by 28.15%.
- The Revenue has been growing by 15.74% on average over the past years. This is quite good.
- The Earnings Per Share is expected to grow by 16.69% on average over the next years. This is quite good.
- The Revenue is expected to grow by 15.91% on average over the next years. This is quite good.
- The EPS growth rate is accelerating: in the next years the growth will be better than in the last years.
Analyzing Valuation Metrics
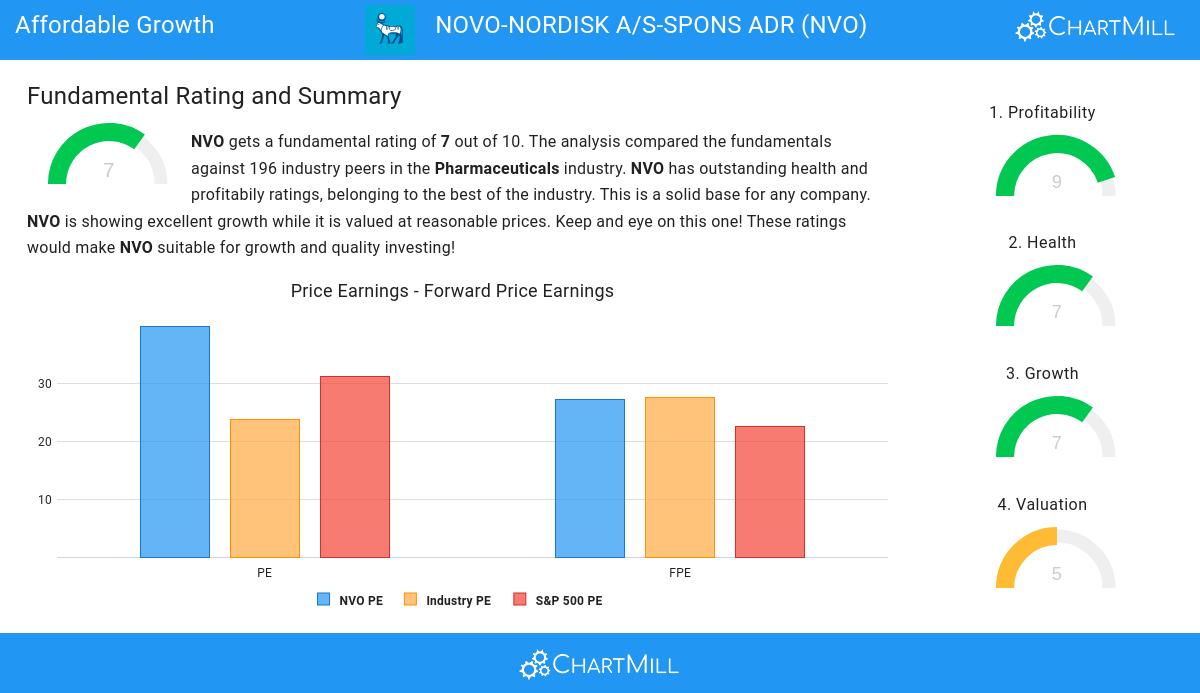
ChartMill employs its own Valuation Rating system for all stocks. This score, ranging from 0 to 10, is determined by evaluating different valuation factors, including price to earnings and free cash flow, both in absolute terms and relative to the market and industry. NYSE:NVO has earned a 5 for valuation:
- Based on the Price/Earnings ratio, NVO is valued cheaper than 80.93% of the companies in the same industry.
- NVO's Price/Forward Earnings ratio is a bit cheaper when compared to the industry. NVO is cheaper than 78.87% of the companies in the same industry.
- NVO's Enterprise Value to EBITDA ratio is a bit cheaper when compared to the industry. NVO is cheaper than 79.38% of the companies in the same industry.
- Compared to the rest of the industry, the Price/Free Cash Flow ratio of NVO indicates a somewhat cheap valuation: NVO is cheaper than 79.38% of the companies listed in the same industry.
- NVO has an outstanding profitability rating, which may justify a higher PE ratio.
- A more expensive valuation may be justified as NVO's earnings are expected to grow with 24.08% in the coming years.
Analyzing Health Metrics
ChartMill employs a unique Health Rating system for all stocks. This rating, ranging from 0 to 10, is determined by analyzing various liquidity and solvency ratios. For NYSE:NVO, the assigned 7 for health provides valuable insights:
- NVO has an Altman-Z score of 10.48. This indicates that NVO is financially healthy and has little risk of bankruptcy at the moment.
- With an excellent Altman-Z score value of 10.48, NVO belongs to the best of the industry, outperforming 84.02% of the companies in the same industry.
- NVO has a debt to FCF ratio of 0.86. This is a very positive value and a sign of high solvency as it would only need 0.86 years to pay back of all of its debts.
- With an excellent Debt to FCF ratio value of 0.86, NVO belongs to the best of the industry, outperforming 96.91% of the companies in the same industry.
- NVO has a Debt/Equity ratio of 0.46. This is a healthy value indicating a solid balance between debt and equity.
- Even though the debt/equity ratio score it not favorable for NVO, it has very limited outstanding debt, so we won't put too much weight on the DE evaluation.
- The current and quick ratio evaluation for NVO is rather negative, while it does have excellent solvency and profitability. These ratios do not necessarly indicate liquidity issues and need to be evaluated against the specifics of the business.
Looking at the Profitability
ChartMill employs its own Profitability Rating system for stock evaluation. This score, ranging from 0 to 10, is derived from an analysis of diverse profitability metrics and margins. In the case of NYSE:NVO, the assigned 9 is noteworthy for profitability:
- NVO has a better Return On Assets (24.34%) than 98.45% of its industry peers.
- NVO's Return On Equity of 79.89% is amongst the best of the industry. NVO outperforms 98.45% of its industry peers.
- NVO's Return On Invested Capital of 51.76% is amongst the best of the industry. NVO outperforms 99.48% of its industry peers.
- NVO had an Average Return On Invested Capital over the past 3 years of 50.71%. This is significantly above the industry average of 41.65%.
- The last Return On Invested Capital (51.76%) for NVO is above the 3 year average (50.71%), which is a sign of increasing profitability.
- NVO has a Profit Margin of 34.84%. This is amongst the best in the industry. NVO outperforms 96.91% of its industry peers.
- Looking at the Operating Margin, with a value of 45.41%, NVO belongs to the top of the industry, outperforming 98.97% of the companies in the same industry.
- The Gross Margin of NVO (84.53%) is better than 90.21% of its industry peers.
More Affordable Growth stocks can be found in our Affordable Growth screener.
For an up to date full fundamental analysis you can check the fundamental report of NVO
Disclaimer
Important Note: The content of this article is not intended as trading advice. It is essential to perform your own analysis and exercise caution when making trading decisions. The article presents observations created by automated analysis but does not guarantee any trading or investment outcomes. Always trade responsibly and make independent judgments.