
Our stock screener has singled out NOVO-NORDISK A/S-SPONS ADR (NYSE:NVO) as an attractive growth opportunity. NYSE:NVO is demonstrating remarkable growth potential while maintaining strong financial indicators, making it a reasonably priced option. We'll explore this further.
Assessing Growth for NYSE:NVO
To evaluate a stock's growth potential, ChartMill utilizes a Growth Rating on a scale of 0 to 10. This comprehensive assessment considers various growth aspects, including historical and estimated EPS and revenue growth. NYSE:NVO has achieved a 7 out of 10:
- The Earnings Per Share has grown by an impressive 34.90% over the past year.
- NVO shows a strong growth in Revenue. In the last year, the Revenue has grown by 28.15%.
- The Revenue has been growing by 15.74% on average over the past years. This is quite good.
- The Earnings Per Share is expected to grow by 16.69% on average over the next years. This is quite good.
- Based on estimates for the next years, NVO will show a quite strong growth in Revenue. The Revenue will grow by 15.91% on average per year.
- When comparing the EPS growth rate of the last years to the growth rate of the upcoming years, we see that the growth is accelerating.
Valuation Assessment of NYSE:NVO
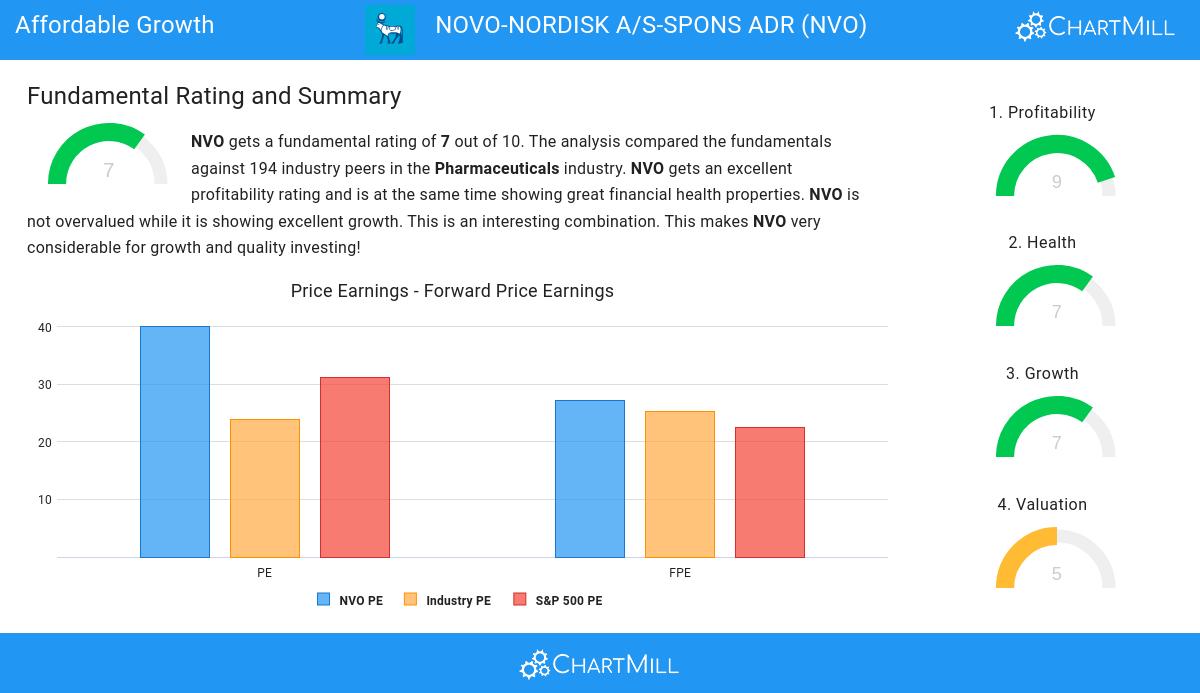
ChartMill assigns a Valuation Rating to each stock, ranging from 0 to 10. This rating is calculated by analyzing different valuation elements, such as price to earnings and free cash flow, both in absolute terms and relative to the market and industry. In the case of NYSE:NVO, the assigned 5 reflects its valuation:
- Compared to the rest of the industry, the Price/Earnings ratio of NVO indicates a rather cheap valuation: NVO is cheaper than 80.83% of the companies listed in the same industry.
- NVO's Price/Forward Earnings ratio is a bit cheaper when compared to the industry. NVO is cheaper than 77.72% of the companies in the same industry.
- Based on the Enterprise Value to EBITDA ratio, NVO is valued a bit cheaper than the industry average as 78.76% of the companies are valued more expensively.
- 79.27% of the companies in the same industry are more expensive than NVO, based on the Price/Free Cash Flow ratio.
- NVO has an outstanding profitability rating, which may justify a higher PE ratio.
- A more expensive valuation may be justified as NVO's earnings are expected to grow with 24.08% in the coming years.
A Closer Look at Health for NYSE:NVO
Every stock is evaluated by ChartMill, receiving a Health Rating on a scale of 0 to 10. This assessment considers different health aspects, including liquidity and solvency, both in absolute terms and relative to industry peers. NYSE:NVO has achieved a 7 out of 10:
- NVO has an Altman-Z score of 10.53. This indicates that NVO is financially healthy and has little risk of bankruptcy at the moment.
- NVO has a better Altman-Z score (10.53) than 84.97% of its industry peers.
- The Debt to FCF ratio of NVO is 0.86, which is an excellent value as it means it would take NVO, only 0.86 years of fcf income to pay off all of its debts.
- With an excellent Debt to FCF ratio value of 0.86, NVO belongs to the best of the industry, outperforming 97.41% of the companies in the same industry.
- NVO has a Debt/Equity ratio of 0.46. This is a healthy value indicating a solid balance between debt and equity.
- Although NVO does not score too well on debt/equity it has very limited outstanding debt, which is well covered by the FCF. We will not put too much weight on the debt/equity number as it may be because of low equity, which could be a consequence of a share buyback program for instance. This needs to be investigated.
- The current and quick ratio evaluation for NVO is rather negative, while it does have excellent solvency and profitability. These ratios do not necessarly indicate liquidity issues and need to be evaluated against the specifics of the business.
A Closer Look at Profitability for NYSE:NVO
ChartMill assigns a Profitability Rating to every stock. This score ranges from 0 to 10 and evaluates the different profitability ratios and margins, both absolutely, but also relative to the industry peers. NYSE:NVO scores a 9 out of 10:
- The Return On Assets of NVO (24.34%) is better than 98.45% of its industry peers.
- Looking at the Return On Equity, with a value of 79.89%, NVO belongs to the top of the industry, outperforming 98.45% of the companies in the same industry.
- Looking at the Return On Invested Capital, with a value of 51.76%, NVO belongs to the top of the industry, outperforming 99.48% of the companies in the same industry.
- Measured over the past 3 years, the Average Return On Invested Capital for NVO is significantly above the industry average of 40.76%.
- The last Return On Invested Capital (51.76%) for NVO is above the 3 year average (50.71%), which is a sign of increasing profitability.
- With an excellent Profit Margin value of 34.84%, NVO belongs to the best of the industry, outperforming 96.89% of the companies in the same industry.
- Looking at the Operating Margin, with a value of 45.41%, NVO belongs to the top of the industry, outperforming 98.96% of the companies in the same industry.
- NVO's Gross Margin of 84.53% is amongst the best of the industry. NVO outperforms 90.16% of its industry peers.
Every day, new Affordable Growth stocks can be found on ChartMill in our Affordable Growth screener.
Our latest full fundamental report of NVO contains the most current fundamental analsysis.
Disclaimer
Important Note: The content of this article is not intended as trading advice. It is essential to perform your own analysis and exercise caution when making trading decisions. The article presents observations created by automated analysis but does not guarantee any trading or investment outcomes. Always trade responsibly and make independent judgments.