
Our stock screener has spotted NOVO-NORDISK A/S-SPONS ADR (NYSE:NVO) as a growth stock which is not overvalued. NYSE:NVO is scoring great on several growth aspects while it also shows decent health and profitability. At the same time it remains remains attractively priced. We'll dive into each aspect below.
Growth Analysis for NYSE:NVO
ChartMill employs its own Growth Rating system for all stocks. This score, ranging from 0 to 10, is derived by evaluating different growth factors, such as EPS and revenue growth, taking into account both past performance and future projections. NYSE:NVO has earned a 7 for growth:
- The Earnings Per Share has grown by an impressive 34.90% over the past year.
- NVO shows a strong growth in Revenue. In the last year, the Revenue has grown by 28.15%.
- The Revenue has been growing by 15.74% on average over the past years. This is quite good.
- The Earnings Per Share is expected to grow by 16.69% on average over the next years. This is quite good.
- NVO is expected to show quite a strong growth in Revenue. In the coming years, the Revenue will grow by 15.91% yearly.
- When comparing the EPS growth rate of the last years to the growth rate of the upcoming years, we see that the growth is accelerating.
Evaluating Valuation: NYSE:NVO
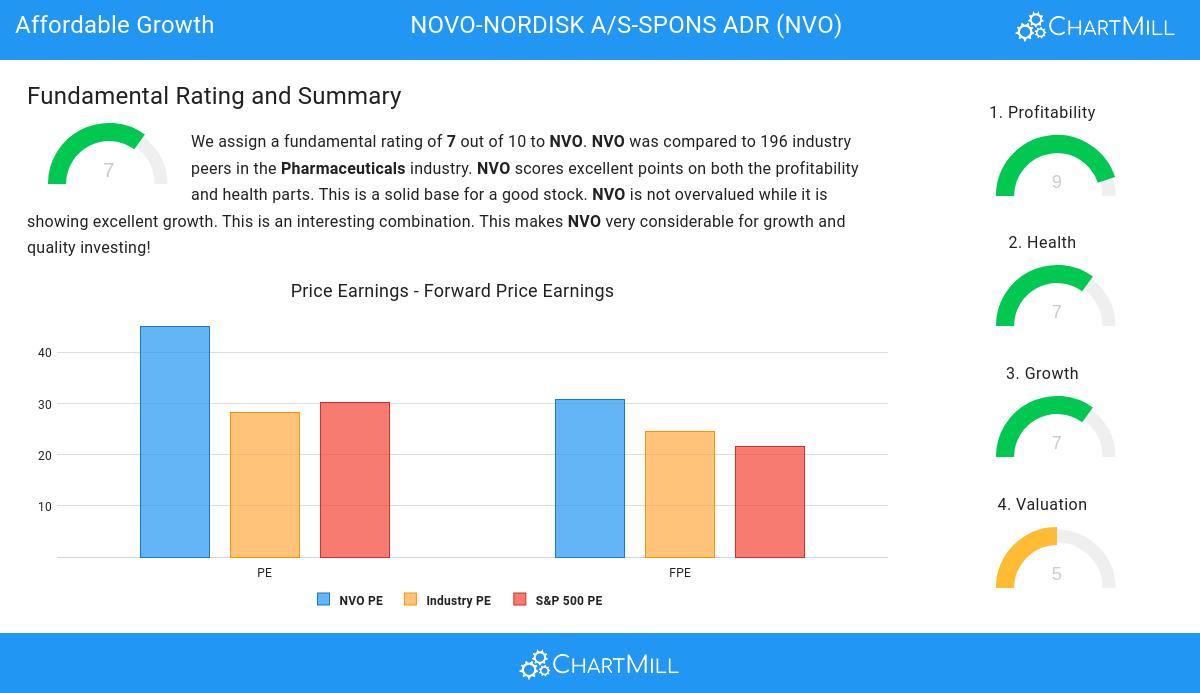
To assess a stock's valuation, ChartMill utilizes a Valuation Rating on a scale of 0 to 10. This comprehensive assessment considers various valuation aspects, comparing price to earnings and cash flows, while factoring in profitability and growth. NYSE:NVO has achieved a 5 out of 10:
- Based on the Price/Earnings ratio, NVO is valued cheaper than 81.03% of the companies in the same industry.
- Based on the Price/Forward Earnings ratio, NVO is valued a bit cheaper than the industry average as 76.41% of the companies are valued more expensively.
- Compared to the rest of the industry, the Enterprise Value to EBITDA ratio of NVO indicates a somewhat cheap valuation: NVO is cheaper than 77.95% of the companies listed in the same industry.
- Based on the Price/Free Cash Flow ratio, NVO is valued cheaper than 80.51% of the companies in the same industry.
- NVO has an outstanding profitability rating, which may justify a higher PE ratio.
- A more expensive valuation may be justified as NVO's earnings are expected to grow with 24.08% in the coming years.
Understanding NYSE:NVO's Health
ChartMill utilizes a Health Rating to assess stocks, scoring them on a scale of 0 to 10. This rating takes into account a variety of liquidity and solvency ratios, both in absolute terms and in comparison to industry peers. NYSE:NVO has earned a 7 out of 10:
- NVO has an Altman-Z score of 11.58. This indicates that NVO is financially healthy and has little risk of bankruptcy at the moment.
- Looking at the Altman-Z score, with a value of 11.58, NVO belongs to the top of the industry, outperforming 87.18% of the companies in the same industry.
- NVO has a debt to FCF ratio of 0.86. This is a very positive value and a sign of high solvency as it would only need 0.86 years to pay back of all of its debts.
- With an excellent Debt to FCF ratio value of 0.86, NVO belongs to the best of the industry, outperforming 97.44% of the companies in the same industry.
- NVO has a Debt/Equity ratio of 0.46. This is a healthy value indicating a solid balance between debt and equity.
- Although NVO does not score too well on debt/equity it has very limited outstanding debt, which is well covered by the FCF. We will not put too much weight on the debt/equity number as it may be because of low equity, which could be a consequence of a share buyback program for instance. This needs to be investigated.
- The current and quick ratio evaluation for NVO is rather negative, while it does have excellent solvency and profitability. These ratios do not necessarly indicate liquidity issues and need to be evaluated against the specifics of the business.
Profitability Assessment of NYSE:NVO
ChartMill employs its own Profitability Rating system for stock evaluation. This score, ranging from 0 to 10, is derived from an analysis of diverse profitability metrics and margins. In the case of NYSE:NVO, the assigned 9 is noteworthy for profitability:
- NVO's Return On Assets of 24.34% is amongst the best of the industry. NVO outperforms 98.46% of its industry peers.
- Looking at the Return On Equity, with a value of 79.89%, NVO belongs to the top of the industry, outperforming 98.46% of the companies in the same industry.
- The Return On Invested Capital of NVO (51.76%) is better than 99.49% of its industry peers.
- The Average Return On Invested Capital over the past 3 years for NVO is significantly above the industry average of 18.12%.
- The 3 year average ROIC (50.71%) for NVO is below the current ROIC(51.76%), indicating increased profibility in the last year.
- NVO's Profit Margin of 34.84% is amongst the best of the industry. NVO outperforms 96.92% of its industry peers.
- NVO has a Operating Margin of 45.41%. This is amongst the best in the industry. NVO outperforms 98.97% of its industry peers.
- NVO has a better Gross Margin (84.53%) than 89.23% of its industry peers.
More Affordable Growth stocks can be found in our Affordable Growth screener.
For an up to date full fundamental analysis you can check the fundamental report of NVO
Keep in mind
This is not investing advice! The article highlights some of the observations at the time of writing, but you should always make your own analysis and invest based on your own insights.