NVIDIA (NVDA) Q4 2025 Earnings Preview & Stock Analysis: AI Growth, Market Risks, and Key Technical Levels
By Kristoff De Turck - reviewed by Aldwin Keppens
Last update: Feb 24, 2025

NVIDIA [NVDA] is scheduled to announce its fourth-quarter earnings for fiscal year 2025 on Wednesday, February 26, 2025, after the market closes.
Analysts project a significant year-over-year revenue increase of approximately 75%, reaching $38.8 billion, with an expected earnings per share (EPS) of $0.86, marking a 66% rise.
This earnings report is particularly anticipated, as it will provide insights into NVIDIA's performance amid recent market dynamics, including competition from emerging AI firms.
Analysts and investors will be closely watching data center growth, AI-related revenue, and forward guidance to assess the company’s trajectory.
To keep an eye on as well:
- Nvidia has consistently beaten expectations, but last quarter’s "beat" was less significant, raising concerns about a potential AI spending slowdown.
- Nvidia is expected to benefit from rising capital expenditures in AI infrastructure, but geopolitical restrictions (e.g., US regulations on AI exports) pose risks.
- As in previous quarters, supply limitations remain the primary constraint on Nvidia’s AI chip business.
- DeepSeek’s AI model was trained with fewer GPUs, raising questions about future demand for Nvidia’s AI chips.
Investors can access the earnings call webcast through NVIDIA's investor relations website.
ChartMill Fundamental Rating Score: 8/10
View the complete ChartMill Fundamental Analysis (FA) report, it contains a fundamental analysis of NVDA, evaluating the profitability, health, valuation and growth aspects
Technical Analysis of NVIDIA (NVDA)
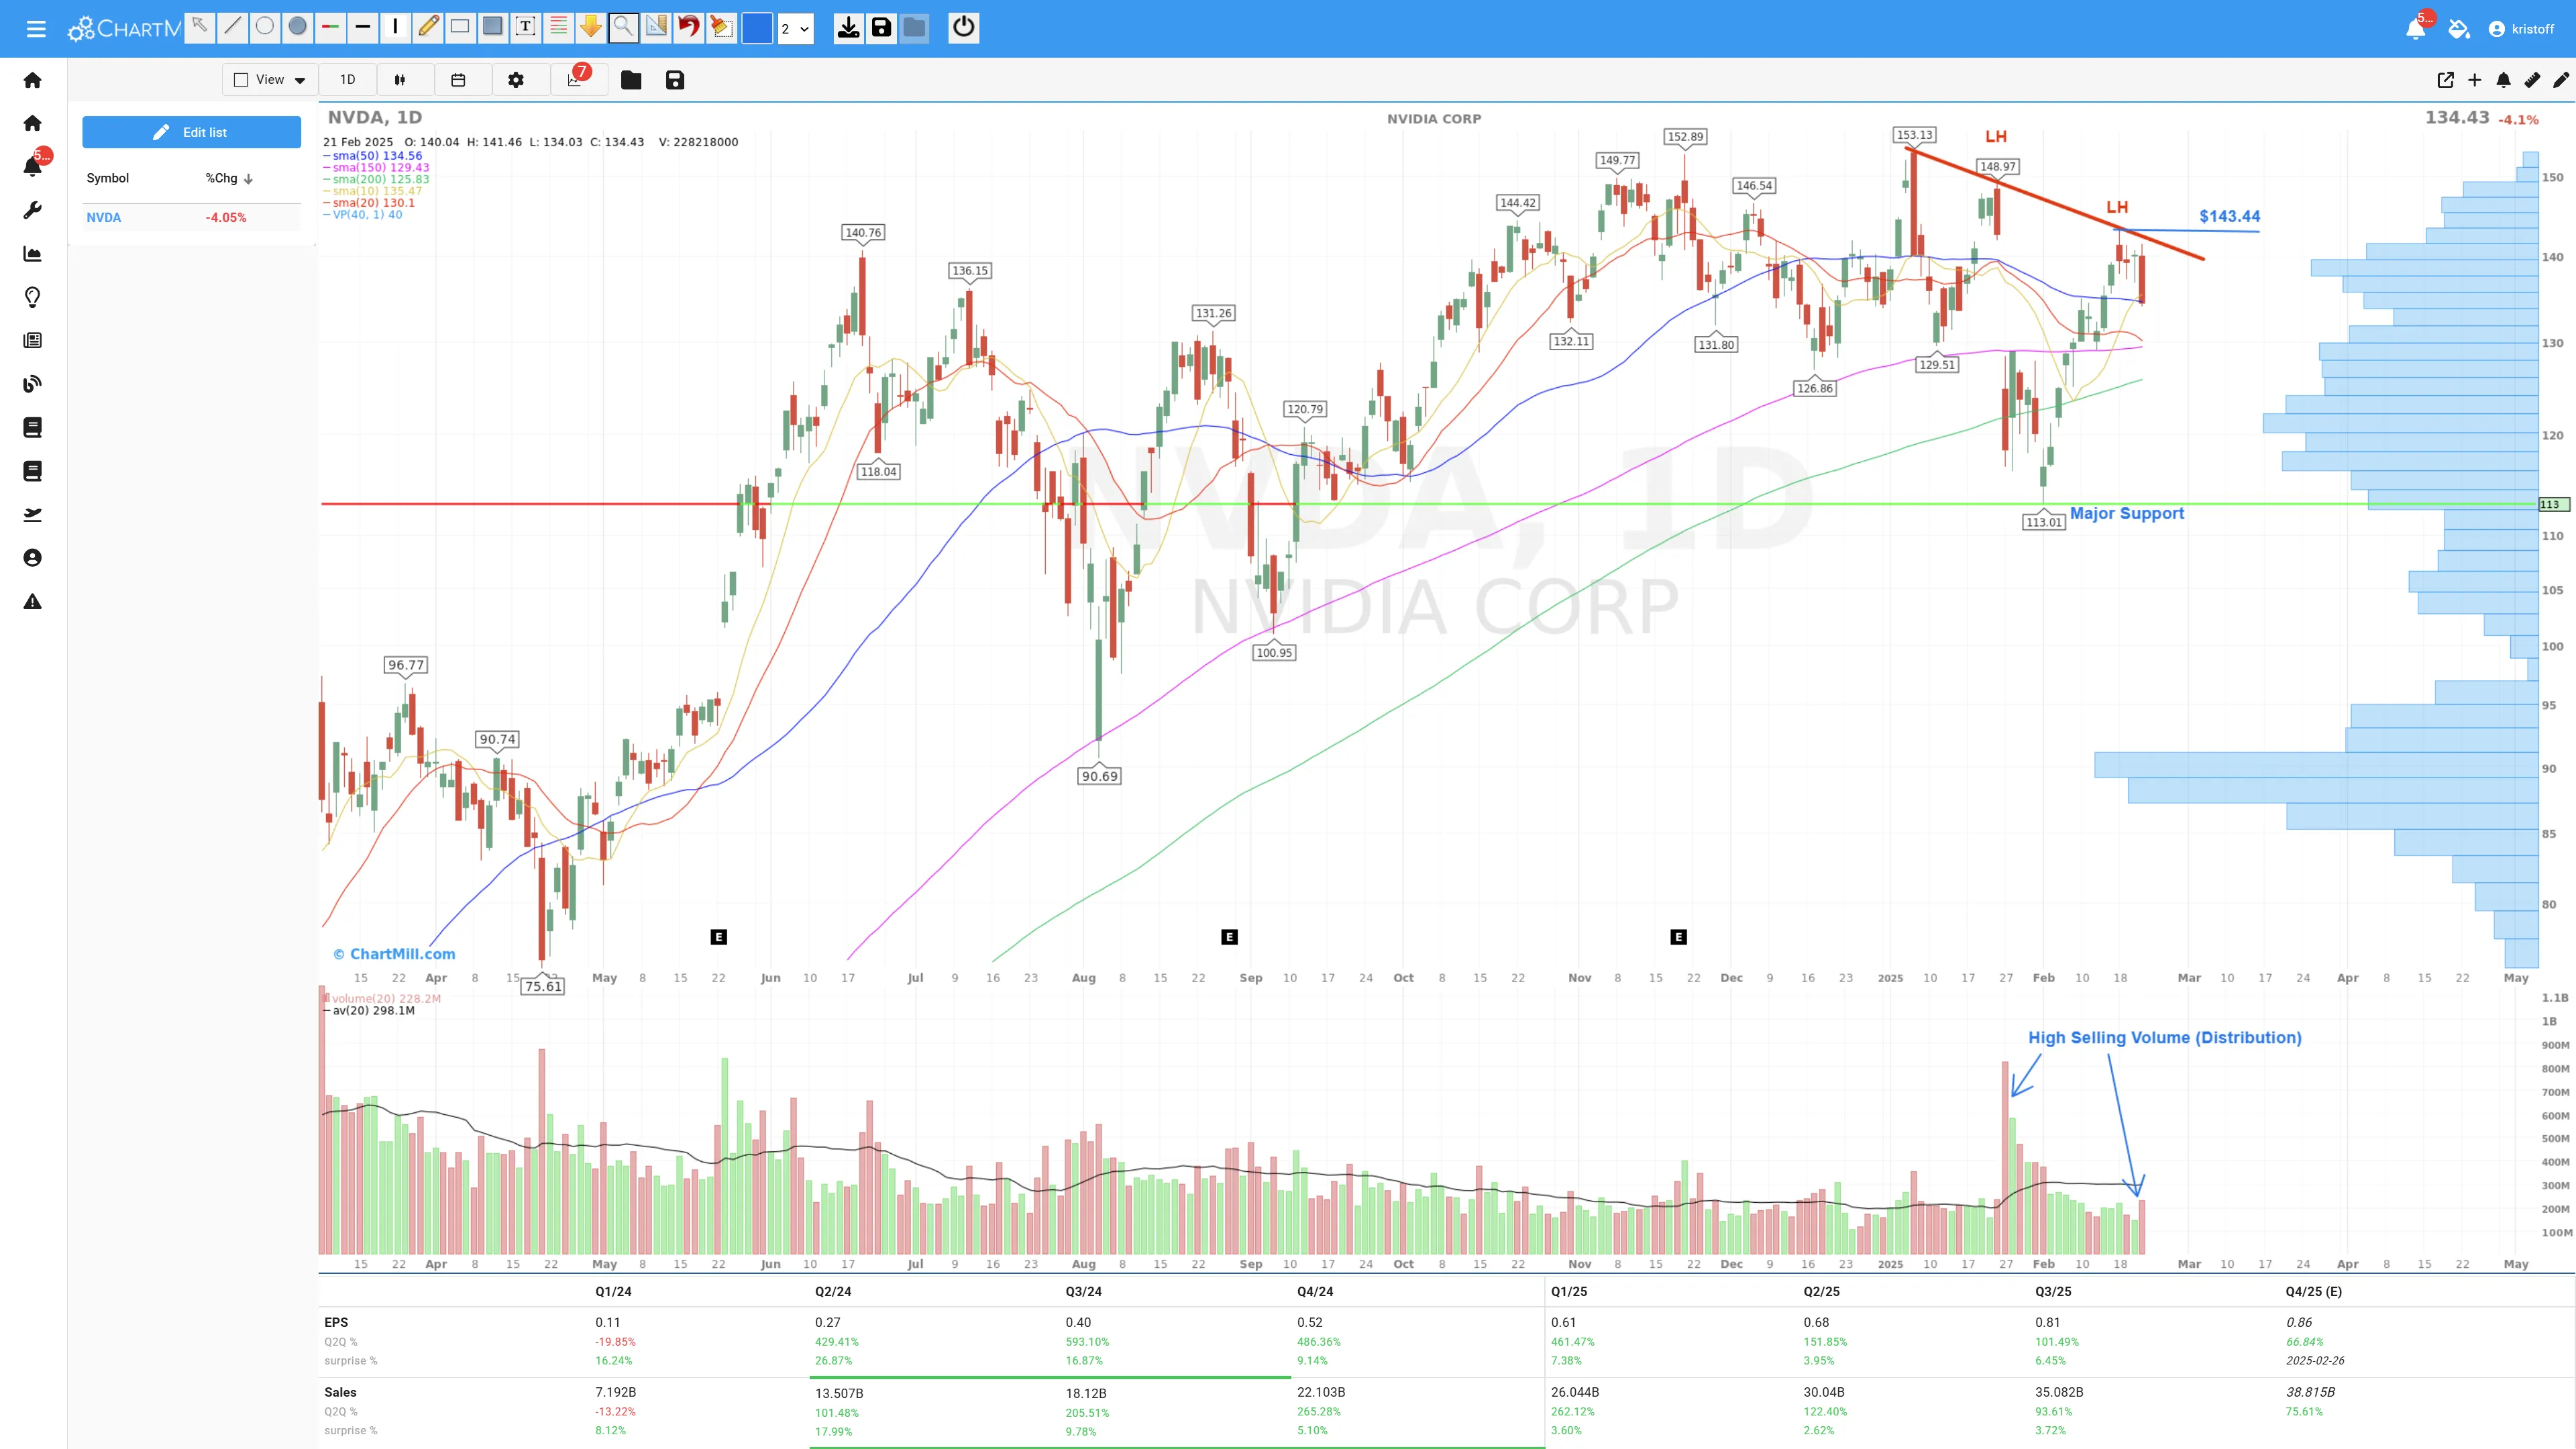
Trend Analysis
- Short-term Trend: The stock appears to be in a downtrend since reaching its most recent high at 153.13. A descending trendline resistance (red line) is visible.
- Long-term Trend: The stock is still above its 200-day moving average (green line), indicating that the long-term uptrend remains intact despite the recent pullback.
Support and Resistance Levels
- Resistance: The downward sloping trendline around 148-153 has been rejecting price attempts to break higher.
- Support: Major support at 113.01 (recent low).
- Previous support around 125, near the 200-day moving average.
- Horizontal support at 130, where price recently bounced.
Moving Averages
-Shorter-term moving averages (20-day & 50-day) are flattening, indicating consolidation.
- The 200-day moving average is trending upwards, showing long-term strength.
- The price is currently just below the 50-day moving average, suggesting weakness in the medium term.
Volume Analysis
- Recent high selling volume during pullbacks suggests distribution (profit-taking).
- The volume profile on the right shows strong interest in the 115-125 range, meaning this could act as a strong demand zone if the price drops further.
Momentum Indicators (Visual)
- The stock has made lower highs, indicating selling pressure at resistance levels.
Key Levels to Watch:
- Bullish Breakout: Needs to reclaim 143 -153 to confirm strength.
- Bearish Breakdown: A drop below 130 could lead to 120 or even 113.
- Long-Term Strength Remains: As long as NVDA stays above the 200-day moving average, the long-term bullish structure is intact.
Earnings and Market Sentiment
- Earnings growth remains strong, but the market is pricing in high expectations.
- A break above the most recent lower high ($143.44) could indicate renewed bullish momentum, while a break below the SMA200 could accelerate selling.
Conclusion
- Despite the fact that the long-term is still bullish, the short-term looks bearish. Price is making lower highs and the recent rejection of the trend line - resulting in a reversal pattern - suggests further downside potential.
- Expect more volatility in the coming days and weeks.
- ChartMill Technical & Setup Rating Score: 8/10 - 3/10
102.71
+3.82 (+3.86%)
Find more stocks in the Stock Screener
NVDA Latest News and Analysis
 2 hours ago - ChartmillMarket Monitor April 24 ( Tesla, Boeing, Intel UP, Enphase Energy DOWN)
U.S. Markets Rally on Softer Trump Tone and Strong Corporate Earnings
 12 hours ago - ChartmillLooking for the most active stocks in the S&P500 index on Wednesday?
Explore the S&P500 index on Wednesday and find out which stocks are the most active in today's session. Stay updated with the stocks that are capturing market interest.
13 hours ago - ChartmillMost active stocks in Wednesday's sessionThese stocks are making the most noise in today's session. Stay tuned for the latest updates!
 a day ago - ChartmillMarket Monitor April 23 ( Tesla, Apple, 3M UP, RTX, Northrop Grumman DOWN)
Wall Street Rebounds Sharply on Trade Optimism and AI Buzz, Despite Tesla’s Struggles
2 days ago - ChartmillLooking for the most active stocks in the S&P500 index on Tuesday?Stay informed about the most active stocks in the S&P500 index on Tuesday's session. Discover the stocks that are generating the highest trading volume and driving market activity.
2 days ago - ChartmillTuesday's session: most active stocksDiscover the most active stocks in Tuesday's session. Stay informed about the stocks that are generating the most trading volume!
3 days ago - ChartmillWhich S&P500 stocks are the most active on Monday?Stay informed about the most active stocks in the S&P500 index on Monday's session. Discover the stocks that are generating the highest trading volume and driving market activity.
3 days ago - ChartmillMost active stocks in Monday's sessionCurious about the most active stocks in today's session? Get a glimpse into the stocks that are generating the highest trading volume and capturing market attention.
 3 days ago - ChartmillGapping S&P500 stocks in Monday's session
Monday's session is showcasing interesting market movements in the S&P500 index, with notable gap up and gap down stocks. Stay updated with the gapping S&P500 stocks in today's session.
 3 days ago - ChartmillGet insights into the top movers in the S&P500 index of Monday's pre-market session.
Discover the top S&P500 movers in Monday's pre-market session and stay informed about market dynamics.
 6 days ago - ChartmillMarket Monitor April 18 ( Netflix UP, DOWN)
Wall Street Mostly Lower Amid Trump-Fed Tensions, Nvidia’s Continued Slide
 6 days ago - ChartmillStay informed with the top movers within the S&P500 index on Thursday.
Stay updated with the movement of S&P500 stocks in today's session. Discover which S&P500 stocks are making waves on Thursday.
