
NASDAQ:NVDA—A High-Growth Stock Gearing Up for Its Next Upward Move.
By Mill Chart
Last update: Oct 28, 2024
In this article, we'll take a closer look at NVIDIA CORP (NASDAQ:NVDA) as a potential candidate for growth investing. While it's important for investors to conduct their own research, NVIDIA CORP has piqued our interest by appearing on our strong growth and breakout radar. Let's explore further.
How do we evaluate the Growth for NASDAQ:NVDA?
To evaluate a stock's growth potential, ChartMill utilizes a Growth Rating on a scale of 0 to 10. This comprehensive assessment considers various growth aspects, including historical and estimated EPS and revenue growth. NASDAQ:NVDA has achieved a 9 out of 10:
- NVDA shows a strong growth in Earnings Per Share. In the last year, the EPS has been growing by 320.95%, which is quite impressive.
- NVDA shows a strong growth in Earnings Per Share. Measured over the last years, the EPS has been growing by 50.90% yearly.
- Looking at the last year, NVDA shows a very strong growth in Revenue. The Revenue has grown by 194.69%.
- NVDA shows a strong growth in Revenue. Measured over the last years, the Revenue has been growing by 39.06% yearly.
- NVDA is expected to show a strong growth in Earnings Per Share. In the coming years, the EPS will grow by 35.09% yearly.
- The Revenue is expected to grow by 32.85% on average over the next years. This is a very strong growth
Assessing Health Metrics for NASDAQ:NVDA
ChartMill assigns a Health Rating to every stock. This score ranges from 0 to 10 and evaluates the different health aspects like liquidity and solvency, both absolutely, but also relative to the industry peers. NASDAQ:NVDA scores a 8 out of 10:
- NVDA has an Altman-Z score of 81.79. This indicates that NVDA is financially healthy and has little risk of bankruptcy at the moment.
- NVDA's Altman-Z score of 81.79 is amongst the best of the industry. NVDA outperforms 98.15% of its industry peers.
- NVDA has a debt to FCF ratio of 0.18. This is a very positive value and a sign of high solvency as it would only need 0.18 years to pay back of all of its debts.
- NVDA has a better Debt to FCF ratio (0.18) than 85.19% of its industry peers.
- A Debt/Equity ratio of 0.15 indicates that NVDA is not too dependend on debt financing.
- NVDA has a Current Ratio of 4.27. This indicates that NVDA is financially healthy and has no problem in meeting its short term obligations.
- NVDA has a Current ratio of 4.27. This is in the better half of the industry: NVDA outperforms 64.81% of its industry peers.
- A Quick Ratio of 3.79 indicates that NVDA has no problem at all paying its short term obligations.
- The Quick ratio of NVDA (3.79) is better than 71.30% of its industry peers.
What does the Profitability looks like for NASDAQ:NVDA
ChartMill assigns a Profitability Rating to every stock. This score ranges from 0 to 10 and evaluates the different profitability ratios and margins, both absolutely, but also relative to the industry peers. NASDAQ:NVDA scores a 10 out of 10:
- Looking at the Return On Assets, with a value of 62.20%, NVDA belongs to the top of the industry, outperforming 100.00% of the companies in the same industry.
- The Return On Equity of NVDA (91.15%) is better than 100.00% of its industry peers.
- NVDA has a Return On Invested Capital of 73.58%. This is amongst the best in the industry. NVDA outperforms 100.00% of its industry peers.
- The Average Return On Invested Capital over the past 3 years for NVDA is significantly above the industry average of 10.78%.
- The 3 year average ROIC (31.07%) for NVDA is below the current ROIC(73.58%), indicating increased profibility in the last year.
- NVDA has a better Profit Margin (55.04%) than 99.07% of its industry peers.
- NVDA's Profit Margin has improved in the last couple of years.
- The Operating Margin of NVDA (61.87%) is better than 99.07% of its industry peers.
- NVDA's Operating Margin has improved in the last couple of years.
- The Gross Margin of NVDA (75.98%) is better than 94.44% of its industry peers.
- NVDA's Gross Margin has improved in the last couple of years.
How does the Setup look for NASDAQ:NVDA
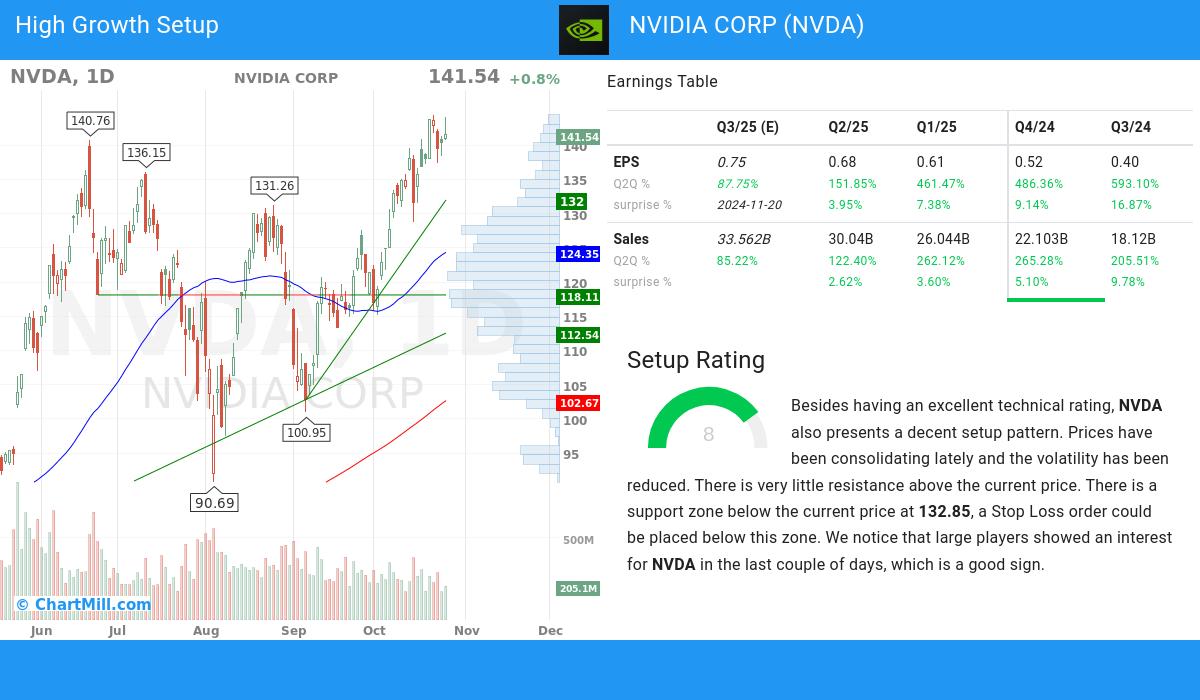
ChartMill also assign a Setup Rating to every stock. With this score it is determined to what extend the stock has been trading in a range in the recent days and weeks. This score also ranges from 0 to 10 and is updated daily. The setup score evaluates various short term technical indicators. NASDAQ:NVDA scores a 8 out of 10:
Besides having an excellent technical rating, NVDA also presents a decent setup pattern. We see reduced volatility while prices have been consolidating in the most recent period. There is very little resistance above the current price. There is a support zone below the current price at 132.85, a Stop Loss order could be placed below this zone. We notice that large players showed an interest for NVDA in the last couple of days, which is a good sign.
Every day, new Strong Growth stocks can be found on ChartMill in our Strong Growth screener.
Our latest full fundamental report of NVDA contains the most current fundamental analsysis.
For an up to date full technical analysis you can check the technical report of NVDA
Keep in mind
Important Note: The content of this article is not intended as trading advice. It is essential to perform your own analysis and exercise caution when making trading decisions. The article presents observations created by automated analysis but does not guarantee any trading or investment outcomes. Always trade responsibly and make independent judgments.