
Why NASDAQ:NTAP qualifies as a good dividend investing stock.
By Mill Chart
Last update: Oct 17, 2024
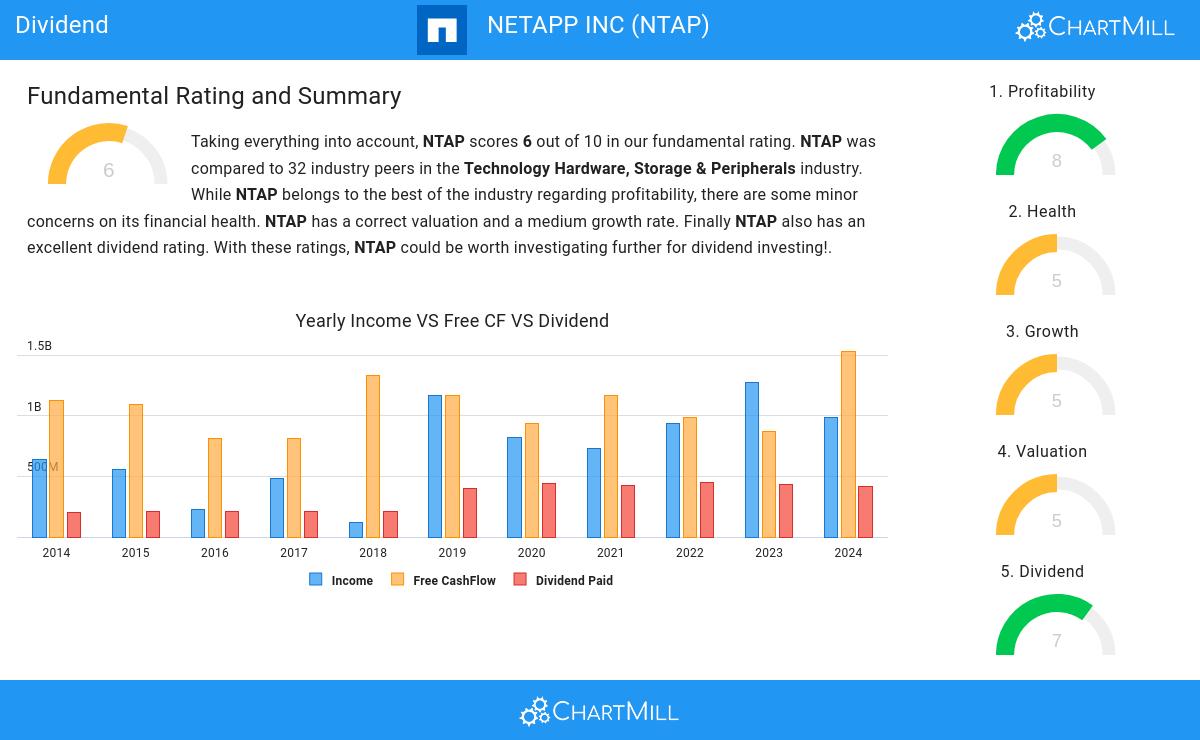
Take a closer look at NETAPP INC (NASDAQ:NTAP), a stock of interest to dividend investors uncovered by our stock screener. NASDAQ:NTAP excels in fundamentals and provides a decent dividend, all while maintaining a reasonable valuation. Let's break it down further.
Evaluating Dividend: NASDAQ:NTAP
ChartMill assigns a Dividend Rating to every stock. This score ranges from 0 to 10 and evaluates the different dividend aspects, including the yield, the growth and sustainability. NASDAQ:NTAP scores a 7 out of 10:
- Compared to an average industry Dividend Yield of 2.74, NTAP pays a better dividend. On top of this NTAP pays more dividend than 81.25% of the companies listed in the same industry.
- NTAP has paid a dividend for at least 10 years, which is a reliable track record.
- NTAP has not decreased its dividend for at least 10 years, so it has a reliable track record of non decreasing dividend.
- 38.43% of the earnings are spent on dividend by NTAP. This is a low number and sustainable payout ratio.
- NTAP's earnings are growing more than its dividend. This makes the dividend growth sustainable.
A Closer Look at Health for NASDAQ:NTAP
To gauge a stock's financial health, ChartMill utilizes a Health Rating on a scale of 0 to 10. This comprehensive evaluation encompasses liquidity and solvency, both in absolute terms and in comparison to industry peers. NASDAQ:NTAP has earned a 5 out of 10:
- With a decent Altman-Z score value of 2.99, NTAP is doing good in the industry, outperforming 71.88% of the companies in the same industry.
- The Debt to FCF ratio of NTAP is 1.69, which is an excellent value as it means it would take NTAP, only 1.69 years of fcf income to pay off all of its debts.
- The Debt to FCF ratio of NTAP (1.69) is better than 87.50% of its industry peers.
- Even though the debt/equity ratio score it not favorable for NTAP, it has very limited outstanding debt, so we won't put too much weight on the DE evaluation.
Profitability Examination for NASDAQ:NTAP
ChartMill assigns a proprietary Profitability Rating to each stock. The score is computed by evaluating various profitability ratios and margins and ranges from 0 to 10. NASDAQ:NTAP was assigned a score of 8 for profitability:
- With an excellent Return On Assets value of 11.65%, NTAP belongs to the best of the industry, outperforming 81.25% of the companies in the same industry.
- With an excellent Return On Equity value of 116.79%, NTAP belongs to the best of the industry, outperforming 93.75% of the companies in the same industry.
- NTAP's Return On Invested Capital of 22.14% is amongst the best of the industry. NTAP outperforms 87.50% of its industry peers.
- The last Return On Invested Capital (22.14%) for NTAP is above the 3 year average (15.62%), which is a sign of increasing profitability.
- Looking at the Profit Margin, with a value of 17.01%, NTAP belongs to the top of the industry, outperforming 90.63% of the companies in the same industry.
- NTAP has a better Operating Margin (21.34%) than 90.63% of its industry peers.
- NTAP has a Gross Margin of 71.11%. This is amongst the best in the industry. NTAP outperforms 96.88% of its industry peers.
- NTAP's Gross Margin has improved in the last couple of years.
More Best Dividend stocks can be found in our Best Dividend screener.
Our latest full fundamental report of NTAP contains the most current fundamental analsysis.
Keep in mind
This article should in no way be interpreted as advice. The article is based on the observed metrics at the time of writing, but you should always make your own analysis and trade or invest at your own responsibility.