
Our stock screener has singled out NETAPP INC (NASDAQ:NTAP) as a promising choice for dividend investors. NASDAQ:NTAP not only scores well in profitability, solvency, and liquidity but also offers a decent dividend. We'll explore this further.
A Closer Look at Dividend for NASDAQ:NTAP
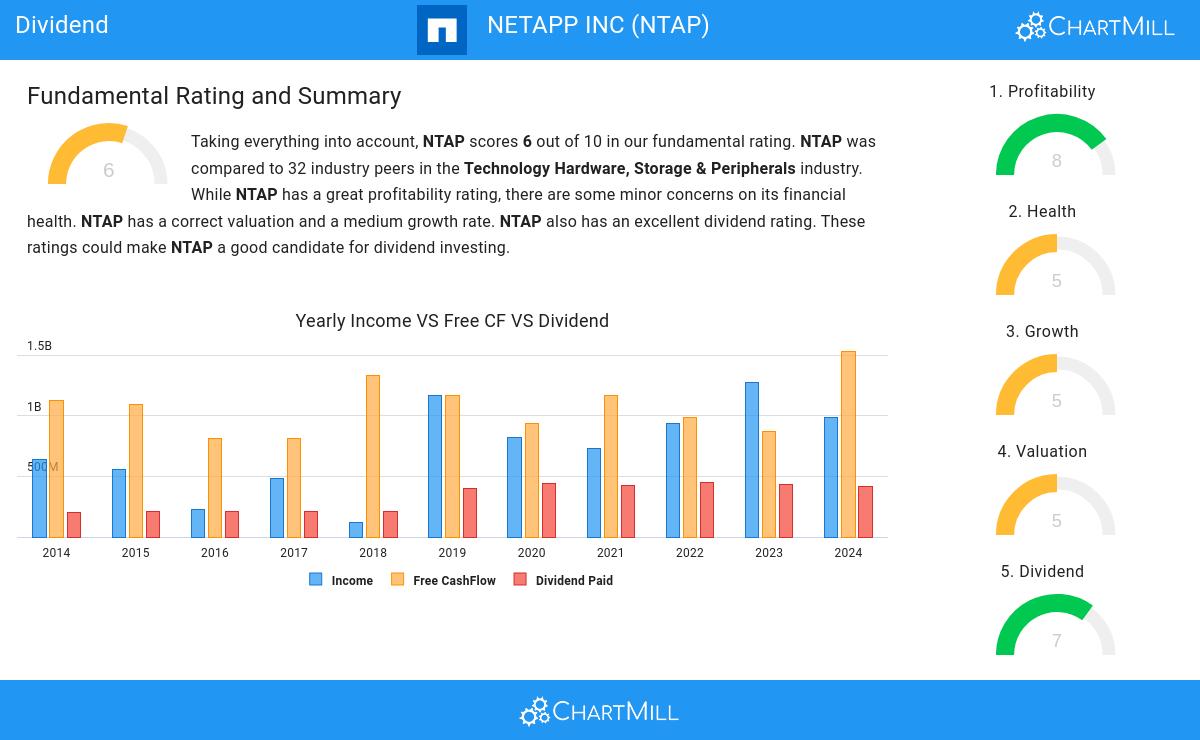
An integral part of ChartMill's stock analysis is the Dividend Rating, which spans from 0 to 10. This rating evaluates diverse dividend factors, including yield, historical data, growth, and sustainability. NASDAQ:NTAP has received a 7 out of 10:
- NTAP's Dividend Yield is rather good when compared to the industry average which is at 2.74. NTAP pays more dividend than 81.25% of the companies in the same industry.
- NTAP has paid a dividend for at least 10 years, which is a reliable track record.
- NTAP has not decreased its dividend for at least 10 years, so it has a reliable track record of non decreasing dividend.
- NTAP pays out 38.43% of its income as dividend. This is a sustainable payout ratio.
- NTAP's earnings are growing more than its dividend. This makes the dividend growth sustainable.
A Closer Look at Health for NASDAQ:NTAP
To gauge a stock's financial health, ChartMill utilizes a Health Rating on a scale of 0 to 10. This comprehensive evaluation encompasses liquidity and solvency, both in absolute terms and in comparison to industry peers. NASDAQ:NTAP has earned a 5 out of 10:
- NTAP has a Altman-Z score of 2.94. This is in the better half of the industry: NTAP outperforms 71.88% of its industry peers.
- The Debt to FCF ratio of NTAP is 1.69, which is an excellent value as it means it would take NTAP, only 1.69 years of fcf income to pay off all of its debts.
- The Debt to FCF ratio of NTAP (1.69) is better than 87.50% of its industry peers.
- Even though the debt/equity ratio score it not favorable for NTAP, it has very limited outstanding debt, so we won't put too much weight on the DE evaluation.
Analyzing Profitability Metrics
ChartMill utilizes a Profitability Rating to assess stocks, scoring them on a scale of 0 to 10. This rating takes into account a variety of profitability ratios and margins, both in absolute terms and in comparison to industry peers. NASDAQ:NTAP has earned a 8 out of 10:
- Looking at the Return On Assets, with a value of 11.65%, NTAP belongs to the top of the industry, outperforming 81.25% of the companies in the same industry.
- NTAP has a Return On Equity of 116.79%. This is amongst the best in the industry. NTAP outperforms 93.75% of its industry peers.
- The Return On Invested Capital of NTAP (22.14%) is better than 87.50% of its industry peers.
- The last Return On Invested Capital (22.14%) for NTAP is above the 3 year average (15.62%), which is a sign of increasing profitability.
- Looking at the Profit Margin, with a value of 17.01%, NTAP belongs to the top of the industry, outperforming 90.63% of the companies in the same industry.
- The Operating Margin of NTAP (21.34%) is better than 90.63% of its industry peers.
- Looking at the Gross Margin, with a value of 71.11%, NTAP belongs to the top of the industry, outperforming 96.88% of the companies in the same industry.
- NTAP's Gross Margin has improved in the last couple of years.
Our Best Dividend screener lists more Best Dividend stocks and is updated daily.
Our latest full fundamental report of NTAP contains the most current fundamental analsysis.
Keep in mind
This is not investing advice! The article highlights some of the observations at the time of writing, but you should always make your own analysis and invest based on your own insights.