
Our stock screener has spotted NETAPP INC (NASDAQ:NTAP) as a good dividend stock with solid fundamentals. NASDAQ:NTAP shows decent health and profitability. At the same time it gives a good and sustainable dividend. We'll dive into each aspect below.
Dividend Assessment of NASDAQ:NTAP
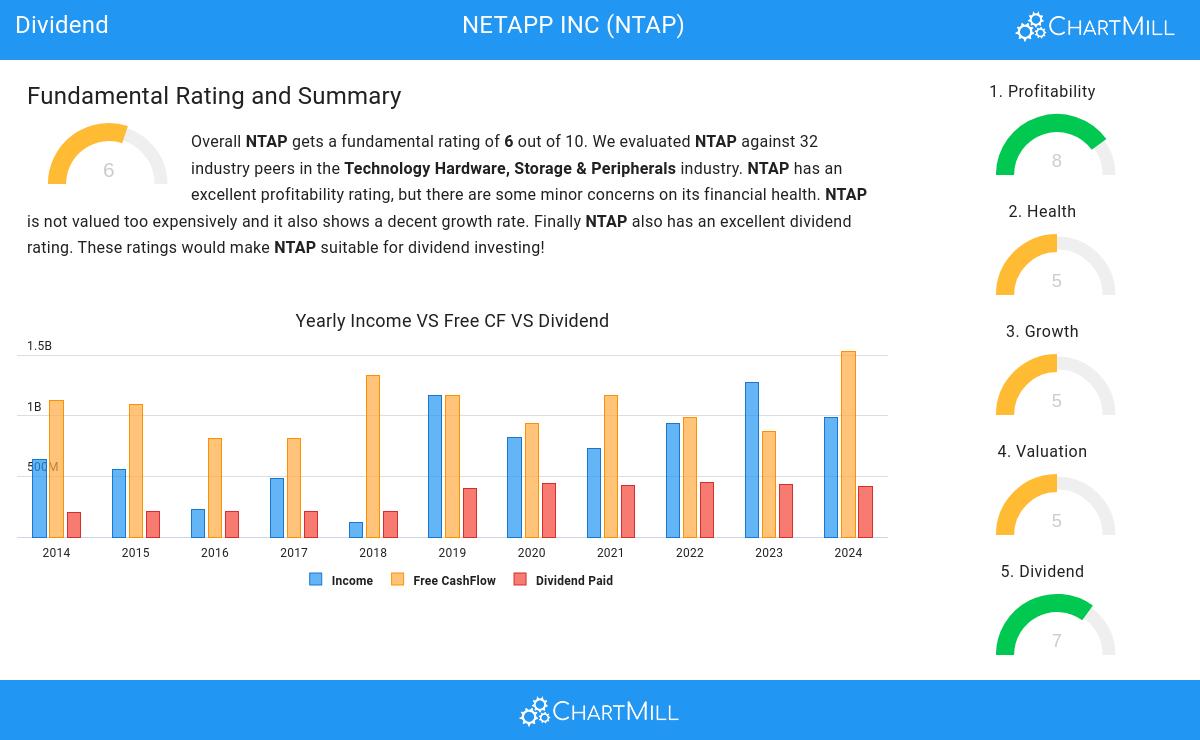
ChartMill employs its own Dividend Rating system for all stocks. This score, on a scale of 0 to 10, is determined by evaluating different dividend factors, such as yield, historical performance, dividend growth, and sustainability. NASDAQ:NTAP has been assigned a 7 for dividend:
- Compared to an average industry Dividend Yield of 2.74, NTAP pays a better dividend. On top of this NTAP pays more dividend than 81.25% of the companies listed in the same industry.
- NTAP has paid a dividend for at least 10 years, which is a reliable track record.
- NTAP has not decreased their dividend for at least 10 years, which is a reliable track record.
- NTAP pays out 38.43% of its income as dividend. This is a sustainable payout ratio.
- The dividend of NTAP is growing, but earnings are growing more, so the dividend growth is sustainable.
Exploring NASDAQ:NTAP's Health
ChartMill employs its own Health Rating for stock assessment. This rating, ranging from 0 to 10, is calculated by examining various liquidity and solvency ratios. In the case of NASDAQ:NTAP, the assigned 5 reflects its health status:
- NTAP has a Altman-Z score of 2.89. This is in the better half of the industry: NTAP outperforms 68.75% of its industry peers.
- NTAP has a debt to FCF ratio of 1.69. This is a very positive value and a sign of high solvency as it would only need 1.69 years to pay back of all of its debts.
- NTAP has a Debt to FCF ratio of 1.69. This is amongst the best in the industry. NTAP outperforms 84.38% of its industry peers.
- Even though the debt/equity ratio score it not favorable for NTAP, it has very limited outstanding debt, so we won't put too much weight on the DE evaluation.
Analyzing Profitability Metrics
Discover ChartMill's exclusive Profitability Rating, a proprietary metric that assesses stocks on a scale of 0 to 10. It takes into consideration various profitability ratios and margins, both in absolute terms and relative to industry peers. Notably, NASDAQ:NTAP has achieved a 8:
- The Return On Assets of NTAP (11.65%) is better than 81.25% of its industry peers.
- The Return On Equity of NTAP (116.79%) is better than 93.75% of its industry peers.
- The Return On Invested Capital of NTAP (22.14%) is better than 90.63% of its industry peers.
- The last Return On Invested Capital (22.14%) for NTAP is above the 3 year average (15.62%), which is a sign of increasing profitability.
- Looking at the Profit Margin, with a value of 17.01%, NTAP belongs to the top of the industry, outperforming 90.63% of the companies in the same industry.
- With an excellent Operating Margin value of 21.34%, NTAP belongs to the best of the industry, outperforming 90.63% of the companies in the same industry.
- NTAP's Gross Margin of 71.11% is amongst the best of the industry. NTAP outperforms 96.88% of its industry peers.
- NTAP's Gross Margin has improved in the last couple of years.
Our Best Dividend screener lists more Best Dividend stocks and is updated daily.
For an up to date full fundamental analysis you can check the fundamental report of NTAP
Keep in mind
This is not investing advice! The article highlights some of the observations at the time of writing, but you should always make your own analysis and invest based on your own insights.