
Uncovering Dividend Opportunities with NYSE:NNN.
By Mill Chart
Last update: Feb 14, 2025
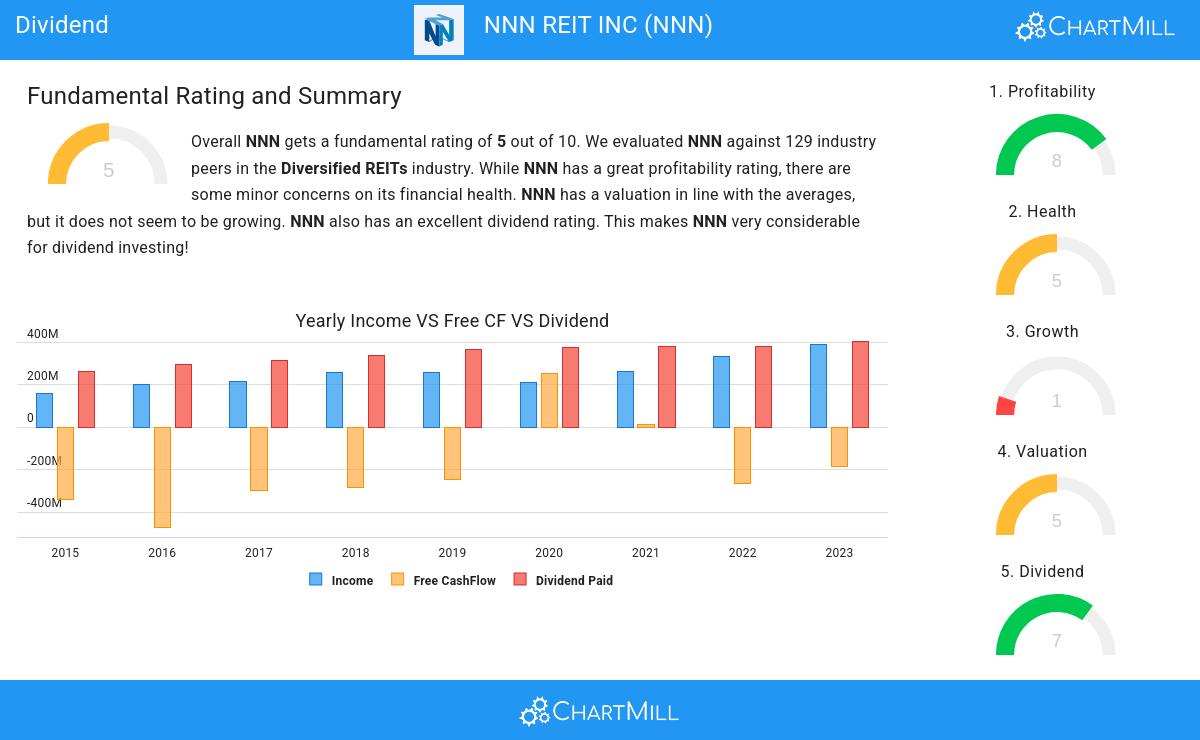
Our stock screening tool has identified NNN REIT INC (NYSE:NNN) as a strong dividend contender with robust fundamentals. NYSE:NNN exhibits commendable financial health and profitability, all while offering a sustainable dividend. Let's delve into each aspect below.
Assessing Dividend Metrics for NYSE:NNN
ChartMill assigns a proprietary Dividend Rating to each stock. The score is computed by evaluating various valuation aspects, like the yield, the history, the dividend growth and sustainability. NYSE:NNN was assigned a score of 7 for dividend:
- With a Yearly Dividend Yield of 5.85%, NNN is a good candidate for dividend investing.
- Compared to an average industry Dividend Yield of 18.79, NNN pays a bit more dividend than its industry peers.
- NNN's Dividend Yield is rather good when compared to the S&P500 average which is at 2.31.
- NNN has paid a dividend for at least 10 years, which is a reliable track record.
- NNN has not decreased its dividend for at least 10 years, so it has a reliable track record of non decreasing dividend.
Health Assessment of NYSE:NNN
ChartMill employs a unique Health Rating system for all stocks. This rating, ranging from 0 to 10, is determined by analyzing various liquidity and solvency ratios. For NYSE:NNN, the assigned 5 for health provides valuable insights:
- The Altman-Z score of NNN (1.27) is better than 82.54% of its industry peers.
- A Current Ratio of 2.33 indicates that NNN has no problem at all paying its short term obligations.
- NNN has a better Current ratio (2.33) than 78.57% of its industry peers.
- A Quick Ratio of 2.33 indicates that NNN has no problem at all paying its short term obligations.
- NNN has a better Quick ratio (2.33) than 80.16% of its industry peers.
Assessing Profitability for NYSE:NNN
ChartMill utilizes a Profitability Rating to assess stocks, scoring them on a scale of 0 to 10. This rating takes into account a variety of profitability ratios and margins, both in absolute terms and in comparison to industry peers. NYSE:NNN has earned a 8 out of 10:
- The Return On Assets of NNN (5.48%) is better than 93.65% of its industry peers.
- NNN's Return On Equity of 11.20% is amongst the best of the industry. NNN outperforms 91.27% of its industry peers.
- Looking at the Return On Invested Capital, with a value of 6.07%, NNN belongs to the top of the industry, outperforming 95.24% of the companies in the same industry.
- The 3 year average ROIC (4.67%) for NNN is below the current ROIC(6.07%), indicating increased profibility in the last year.
- Looking at the Profit Margin, with a value of 45.19%, NNN belongs to the top of the industry, outperforming 92.86% of the companies in the same industry.
- NNN's Profit Margin has improved in the last couple of years.
- Looking at the Operating Margin, with a value of 62.82%, NNN belongs to the top of the industry, outperforming 97.62% of the companies in the same industry.
- NNN has a better Gross Margin (96.62%) than 96.83% of its industry peers.
More Best Dividend stocks can be found in our Best Dividend screener.
Our latest full fundamental report of NNN contains the most current fundamental analsysis.
Keep in mind
Important Note: The content of this article is not intended as trading advice. It is essential to perform your own analysis and exercise caution when making trading decisions. The article presents observations created by automated analysis but does not guarantee any trading or investment outcomes. Always trade responsibly and make independent judgments.
