
Investors should take notice of NASDAQ:NICE—it offers a great deal for the fundamentals it presents.
By Mill Chart
Last update: Feb 25, 2025
Uncover the potential of NICE LTD - SPON ADR (NASDAQ:NICE) as our stock screener's choice for an undervalued stock. NASDAQ:NICE maintains a strong financial position and offers an appealing valuation. We'll delve into the specifics below.
Evaluating Valuation: NASDAQ:NICE
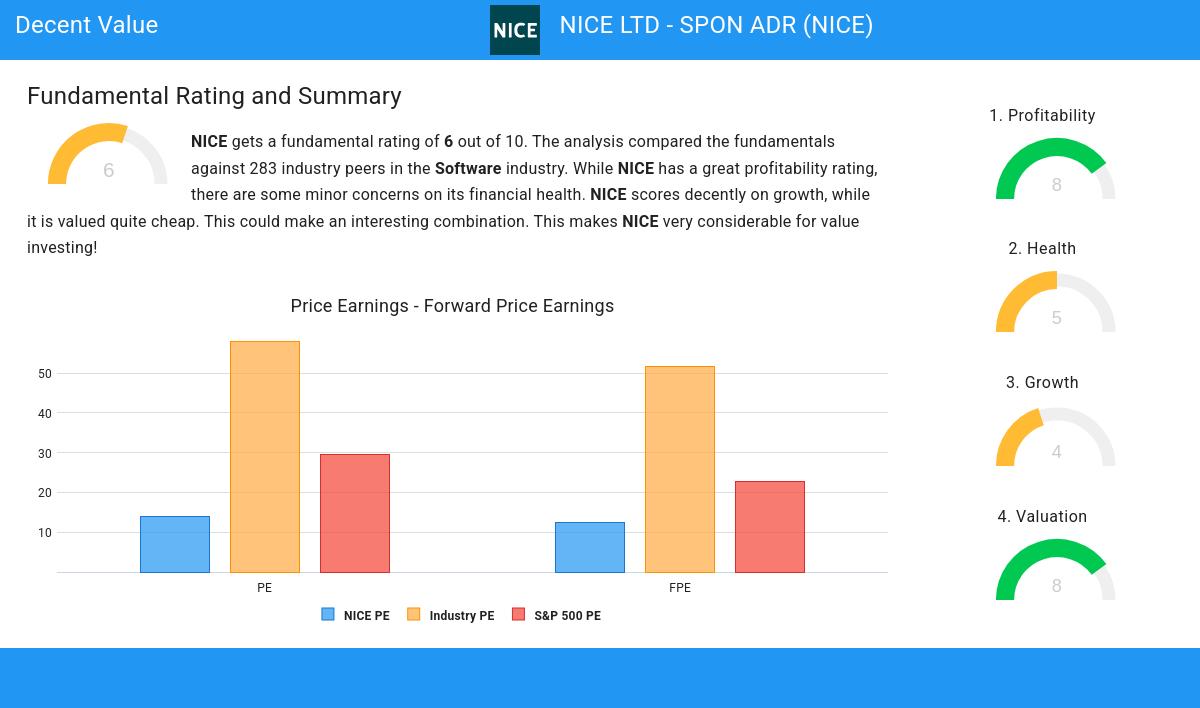
ChartMill employs its own Valuation Rating system for all stocks. This score, ranging from 0 to 10, is determined by evaluating different valuation factors, including price to earnings and free cash flow, both in absolute terms and relative to the market and industry. NASDAQ:NICE has earned a 8 for valuation:
- NICE's Price/Earnings ratio is rather cheap when compared to the industry. NICE is cheaper than 86.91% of the companies in the same industry.
- NICE is valuated cheaply when we compare the Price/Earnings ratio to 29.53, which is the current average of the S&P500 Index.
- Based on the Price/Forward Earnings ratio, NICE is valued cheaper than 90.18% of the companies in the same industry.
- The average S&P500 Price/Forward Earnings ratio is at 22.65. NICE is valued slightly cheaper when compared to this.
- Compared to the rest of the industry, the Enterprise Value to EBITDA ratio of NICE indicates a rather cheap valuation: NICE is cheaper than 92.36% of the companies listed in the same industry.
- Compared to the rest of the industry, the Price/Free Cash Flow ratio of NICE indicates a rather cheap valuation: NICE is cheaper than 89.82% of the companies listed in the same industry.
- The excellent profitability rating of NICE may justify a higher PE ratio.
- A more expensive valuation may be justified as NICE's earnings are expected to grow with 12.60% in the coming years.
A Closer Look at Profitability for NASDAQ:NICE
Discover ChartMill's exclusive Profitability Rating, a proprietary metric that assesses stocks on a scale of 0 to 10. It takes into consideration various profitability ratios and margins, both in absolute terms and relative to industry peers. Notably, NASDAQ:NICE has achieved a 8:
- NICE has a better Return On Assets (8.15%) than 83.27% of its industry peers.
- Looking at the Return On Equity, with a value of 11.85%, NICE belongs to the top of the industry, outperforming 80.73% of the companies in the same industry.
- NICE has a better Return On Invested Capital (10.60%) than 86.55% of its industry peers.
- The 3 year average ROIC (7.04%) for NICE is below the current ROIC(10.60%), indicating increased profibility in the last year.
- The Profit Margin of NICE (16.04%) is better than 81.82% of its industry peers.
- NICE's Profit Margin has improved in the last couple of years.
- NICE has a better Operating Margin (20.05%) than 87.64% of its industry peers.
- NICE's Operating Margin has improved in the last couple of years.
Health Assessment of NASDAQ:NICE
Every stock is evaluated by ChartMill, receiving a Health Rating on a scale of 0 to 10. This assessment considers different health aspects, including liquidity and solvency, both in absolute terms and relative to industry peers. NASDAQ:NICE has achieved a 5 out of 10:
- There is no outstanding debt for NICE. This means it has a Debt/Equity and Debt/FCF ratio of 0 and it is amongst the best of the sector and industry.
Evaluating Growth: NASDAQ:NICE
A key component of ChartMill's stock assessment is the Growth Rating, which spans from 0 to 10. This rating evaluates diverse growth factors, such as EPS and revenue growth, considering both past performance and future projections. NASDAQ:NICE has received a 4 out of 10:
- NICE shows a strong growth in Earnings Per Share. In the last year, the EPS has been growing by 26.51%, which is quite impressive.
- Measured over the past years, NICE shows a quite strong growth in Earnings Per Share. The EPS has been growing by 15.93% on average per year.
- Based on estimates for the next years, NICE will show a quite strong growth in Earnings Per Share. The EPS will grow by 12.60% on average per year.
- NICE is expected to show quite a strong growth in Revenue. In the coming years, the Revenue will grow by 9.54% yearly.
Every day, new Decent Value stocks can be found on ChartMill in our Decent Value screener.
Our latest full fundamental report of NICE contains the most current fundamental analsysis.
Keep in mind
This article should in no way be interpreted as advice. The article is based on the observed metrics at the time of writing, but you should always make your own analysis and trade or invest at your own responsibility.
