
For those who appreciate value investing, NASDAQ:NICE is a compelling option with its solid fundamentals.
By Mill Chart
Last update: Oct 16, 2024
Uncover the potential of NICE LTD - SPON ADR (NASDAQ:NICE) as our stock screener's choice for an undervalued stock. NASDAQ:NICE maintains a strong financial position and offers an appealing valuation. We'll delve into the specifics below.
How We Gauge Valuation for NASDAQ:NICE
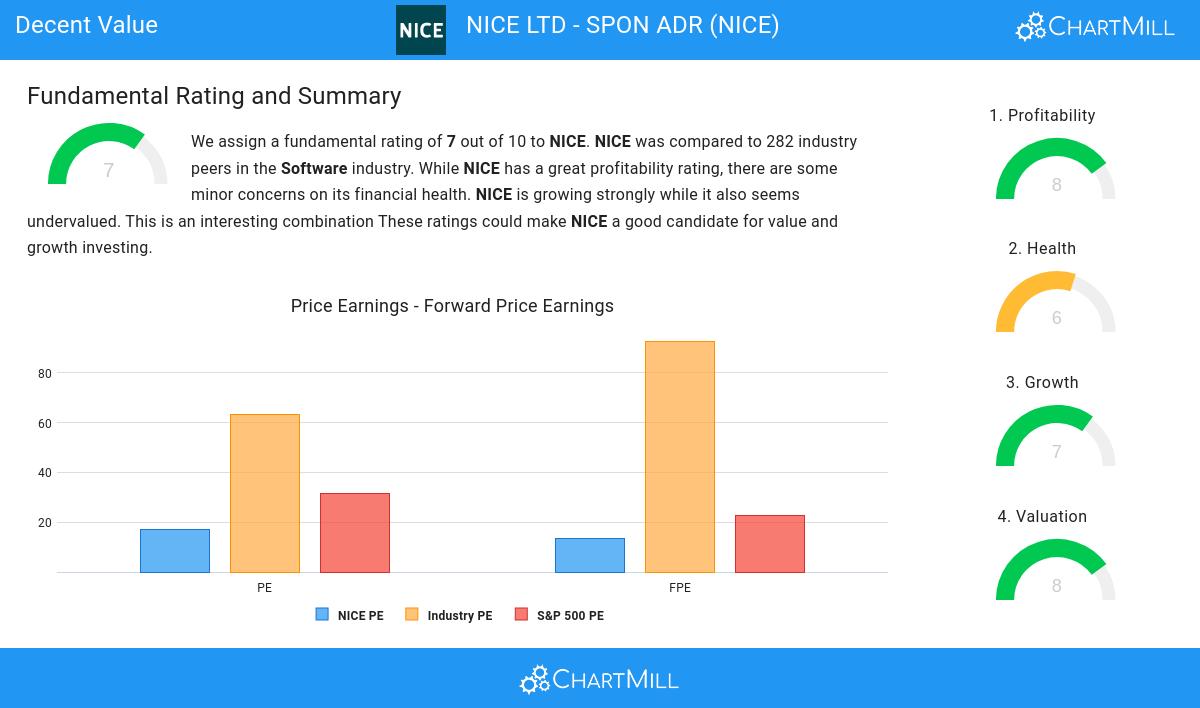
ChartMill provides a Valuation Rating to every stock, ranging from 0 to 10. This rating assesses various valuation aspects, comparing price to earnings and cash flows, while considering factors like profitability and growth. NASDAQ:NICE boasts a 8 out of 10:
- NICE's Price/Earnings ratio is rather cheap when compared to the industry. NICE is cheaper than 84.64% of the companies in the same industry.
- When comparing the Price/Earnings ratio of NICE to the average of the S&P500 Index (31.61), we can say NICE is valued slightly cheaper.
- NICE's Price/Forward Earnings ratio is rather cheap when compared to the industry. NICE is cheaper than 86.43% of the companies in the same industry.
- When comparing the Price/Forward Earnings ratio of NICE to the average of the S&P500 Index (22.63), we can say NICE is valued slightly cheaper.
- 86.79% of the companies in the same industry are more expensive than NICE, based on the Enterprise Value to EBITDA ratio.
- Based on the Price/Free Cash Flow ratio, NICE is valued cheaper than 86.43% of the companies in the same industry.
- NICE's low PEG Ratio(NY), which compensates the Price/Earnings for growth, indicates a rather cheap valuation of the company.
- The excellent profitability rating of NICE may justify a higher PE ratio.
- NICE's earnings are expected to grow with 16.47% in the coming years. This may justify a more expensive valuation.
Profitability Analysis for NASDAQ:NICE
ChartMill assigns a Profitability Rating to every stock. This score ranges from 0 to 10 and evaluates the different profitability ratios and margins, both absolutely, but also relative to the industry peers. NASDAQ:NICE scores a 8 out of 10:
- NICE has a better Return On Assets (7.81%) than 83.93% of its industry peers.
- With an excellent Return On Equity value of 11.41%, NICE belongs to the best of the industry, outperforming 82.86% of the companies in the same industry.
- With an excellent Return On Invested Capital value of 9.18%, NICE belongs to the best of the industry, outperforming 86.07% of the companies in the same industry.
- The 3 year average ROIC (7.04%) for NICE is below the current ROIC(9.18%), indicating increased profibility in the last year.
- NICE has a better Profit Margin (15.48%) than 82.86% of its industry peers.
- NICE's Profit Margin has improved in the last couple of years.
- The Operating Margin of NICE (19.64%) is better than 89.29% of its industry peers.
- In the last couple of years the Operating Margin of NICE has grown nicely.
Health Analysis for NASDAQ:NICE
ChartMill assigns a proprietary Health Rating to each stock. The score is computed by evaluating various liquidity and solvency ratios and ranges from 0 to 10. NASDAQ:NICE was assigned a score of 6 for health:
- NICE has a debt to FCF ratio of 0.72. This is a very positive value and a sign of high solvency as it would only need 0.72 years to pay back of all of its debts.
- With a decent Debt to FCF ratio value of 0.72, NICE is doing good in the industry, outperforming 75.71% of the companies in the same industry.
- NICE has a Debt/Equity ratio of 0.13. This is a healthy value indicating a solid balance between debt and equity.
- A Current Ratio of 2.45 indicates that NICE has no problem at all paying its short term obligations.
- The Current ratio of NICE (2.45) is better than 68.57% of its industry peers.
- A Quick Ratio of 2.45 indicates that NICE has no problem at all paying its short term obligations.
- NICE has a better Quick ratio (2.45) than 70.00% of its industry peers.
Evaluating Growth: NASDAQ:NICE
ChartMill assigns a Growth Rating to every stock. This score ranges from 0 to 10 and evaluates the different growth aspects like EPS and Revenue, both in the past as in the future. NASDAQ:NICE scores a 7 out of 10:
- NICE shows a strong growth in Earnings Per Share. In the last year, the EPS has been growing by 21.29%, which is quite impressive.
- Measured over the past years, NICE shows a quite strong growth in Earnings Per Share. The EPS has been growing by 13.44% on average per year.
- Looking at the last year, NICE shows a quite strong growth in Revenue. The Revenue has grown by 11.95% in the last year.
- The Revenue has been growing by 10.48% on average over the past years. This is quite good.
- The Earnings Per Share is expected to grow by 16.47% on average over the next years. This is quite good.
- The Revenue is expected to grow by 12.24% on average over the next years. This is quite good.
- The EPS growth rate is accelerating: in the next years the growth will be better than in the last years.
Our Decent Value screener lists more Decent Value stocks and is updated daily.
For an up to date full fundamental analysis you can check the fundamental report of NICE
Keep in mind
This is not investing advice! The article highlights some of the observations at the time of writing, but you should always make your own analysis and invest based on your own insights.
