
Uncover the hidden value in NICE LTD - SPON ADR (NASDAQ:NICE) as our stock screening tool recommends it as an undervalued choice. NASDAQ:NICE maintains a robust financial position and offers an attractive pricing perspective. Let's dig deeper into the analysis.
Looking at the Valuation
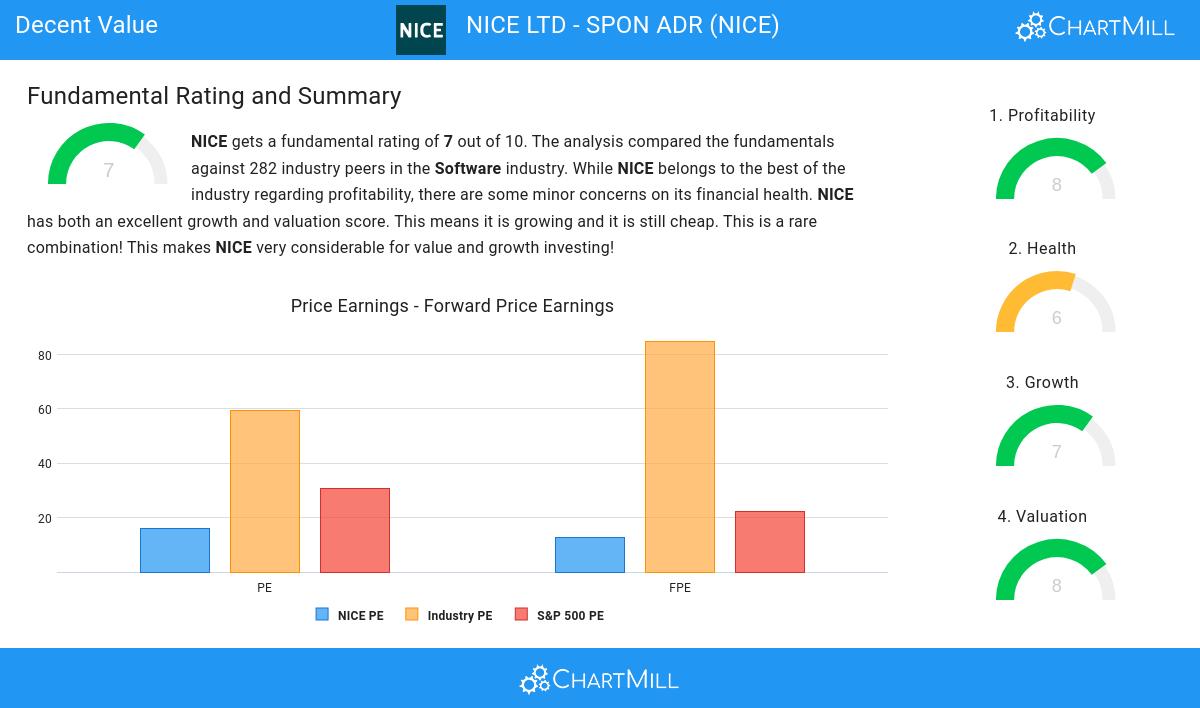
ChartMill assigns a Valuation Rating to every stock. This score ranges from 0 to 10 and evaluates the different valuation aspects and compares the price to earnings and cash flows, while taking into account profitability and growth. NASDAQ:NICE scores a 8 out of 10:
- Based on the Price/Earnings ratio, NICE is valued cheaply inside the industry as 85.05% of the companies are valued more expensively.
- Compared to an average S&P500 Price/Earnings ratio of 30.69, NICE is valued a bit cheaper.
- 87.19% of the companies in the same industry are more expensive than NICE, based on the Price/Forward Earnings ratio.
- NICE is valuated rather cheaply when we compare the Price/Forward Earnings ratio to 22.27, which is the current average of the S&P500 Index.
- Based on the Enterprise Value to EBITDA ratio, NICE is valued cheaply inside the industry as 89.68% of the companies are valued more expensively.
- NICE's Price/Free Cash Flow ratio is rather cheap when compared to the industry. NICE is cheaper than 87.19% of the companies in the same industry.
- NICE's low PEG Ratio(NY), which compensates the Price/Earnings for growth, indicates a rather cheap valuation of the company.
- NICE has an outstanding profitability rating, which may justify a higher PE ratio.
- A more expensive valuation may be justified as NICE's earnings are expected to grow with 16.47% in the coming years.
Profitability Examination for NASDAQ:NICE
ChartMill assigns a proprietary Profitability Rating to each stock. The score is computed by evaluating various profitability ratios and margins and ranges from 0 to 10. NASDAQ:NICE was assigned a score of 8 for profitability:
- NICE has a Return On Assets of 7.81%. This is amongst the best in the industry. NICE outperforms 84.34% of its industry peers.
- The Return On Equity of NICE (11.41%) is better than 83.27% of its industry peers.
- With an excellent Return On Invested Capital value of 9.18%, NICE belongs to the best of the industry, outperforming 86.12% of the companies in the same industry.
- The 3 year average ROIC (7.04%) for NICE is below the current ROIC(9.18%), indicating increased profibility in the last year.
- With an excellent Profit Margin value of 15.48%, NICE belongs to the best of the industry, outperforming 83.27% of the companies in the same industry.
- In the last couple of years the Profit Margin of NICE has grown nicely.
- NICE has a better Operating Margin (19.64%) than 89.32% of its industry peers.
- NICE's Operating Margin has improved in the last couple of years.
How do we evaluate the Health for NASDAQ:NICE?
ChartMill employs its own Health Rating for stock assessment. This rating, ranging from 0 to 10, is calculated by examining various liquidity and solvency ratios. In the case of NASDAQ:NICE, the assigned 6 reflects its health status:
- The Debt to FCF ratio of NICE is 0.72, which is an excellent value as it means it would take NICE, only 0.72 years of fcf income to pay off all of its debts.
- NICE's Debt to FCF ratio of 0.72 is fine compared to the rest of the industry. NICE outperforms 75.44% of its industry peers.
- A Debt/Equity ratio of 0.13 indicates that NICE is not too dependend on debt financing.
- NICE has a Current Ratio of 2.45. This indicates that NICE is financially healthy and has no problem in meeting its short term obligations.
- NICE has a Current ratio of 2.45. This is in the better half of the industry: NICE outperforms 68.68% of its industry peers.
- NICE has a Quick Ratio of 2.45. This indicates that NICE is financially healthy and has no problem in meeting its short term obligations.
- NICE's Quick ratio of 2.45 is fine compared to the rest of the industry. NICE outperforms 70.11% of its industry peers.
Looking at the Growth
A key component of ChartMill's stock assessment is the Growth Rating, which spans from 0 to 10. This rating evaluates diverse growth factors, such as EPS and revenue growth, considering both past performance and future projections. NASDAQ:NICE has received a 7 out of 10:
- The Earnings Per Share has grown by an impressive 21.29% over the past year.
- The Earnings Per Share has been growing by 13.44% on average over the past years. This is quite good.
- The Revenue has grown by 11.95% in the past year. This is quite good.
- NICE shows quite a strong growth in Revenue. Measured over the last years, the Revenue has been growing by 10.48% yearly.
- The Earnings Per Share is expected to grow by 16.47% on average over the next years. This is quite good.
- The Revenue is expected to grow by 12.28% on average over the next years. This is quite good.
- The EPS growth rate is accelerating: in the next years the growth will be better than in the last years.
More Decent Value stocks can be found in our Decent Value screener.
For an up to date full fundamental analysis you can check the fundamental report of NICE
Disclaimer
This article should in no way be interpreted as advice. The article is based on the observed metrics at the time of writing, but you should always make your own analysis and trade or invest at your own responsibility.