
Looking for growth without the hefty price tag? Consider NASDAQ:NICE.
By Mill Chart
Last update: Sep 9, 2024
Our stock screener has spotted NICE LTD - SPON ADR (NASDAQ:NICE) as a growth stock which is not overvalued. NASDAQ:NICE is scoring great on several growth aspects while it also shows decent health and profitability. At the same time it remains remains attractively priced. We'll dive into each aspect below.
Evaluating Growth: NASDAQ:NICE
Every stock receives a Growth Rating from ChartMill, ranging from 0 to 10. This rating assesses various growth aspects, including historical and projected EPS and revenue growth. NASDAQ:NICE boasts a 7 out of 10:
- NICE shows a strong growth in Earnings Per Share. In the last year, the EPS has been growing by 21.29%, which is quite impressive.
- NICE shows quite a strong growth in Earnings Per Share. Measured over the last years, the EPS has been growing by 13.44% yearly.
- The Revenue has grown by 11.95% in the past year. This is quite good.
- Measured over the past years, NICE shows a quite strong growth in Revenue. The Revenue has been growing by 10.48% on average per year.
- Based on estimates for the next years, NICE will show a quite strong growth in Earnings Per Share. The EPS will grow by 16.47% on average per year.
- Based on estimates for the next years, NICE will show a quite strong growth in Revenue. The Revenue will grow by 12.28% on average per year.
- When comparing the EPS growth rate of the last years to the growth rate of the upcoming years, we see that the growth is accelerating.
Analyzing Valuation Metrics
ChartMill provides a Valuation Rating to every stock, ranging from 0 to 10. This rating assesses various valuation aspects, comparing price to earnings and cash flows, while considering factors like profitability and growth. NASDAQ:NICE boasts a 8 out of 10:
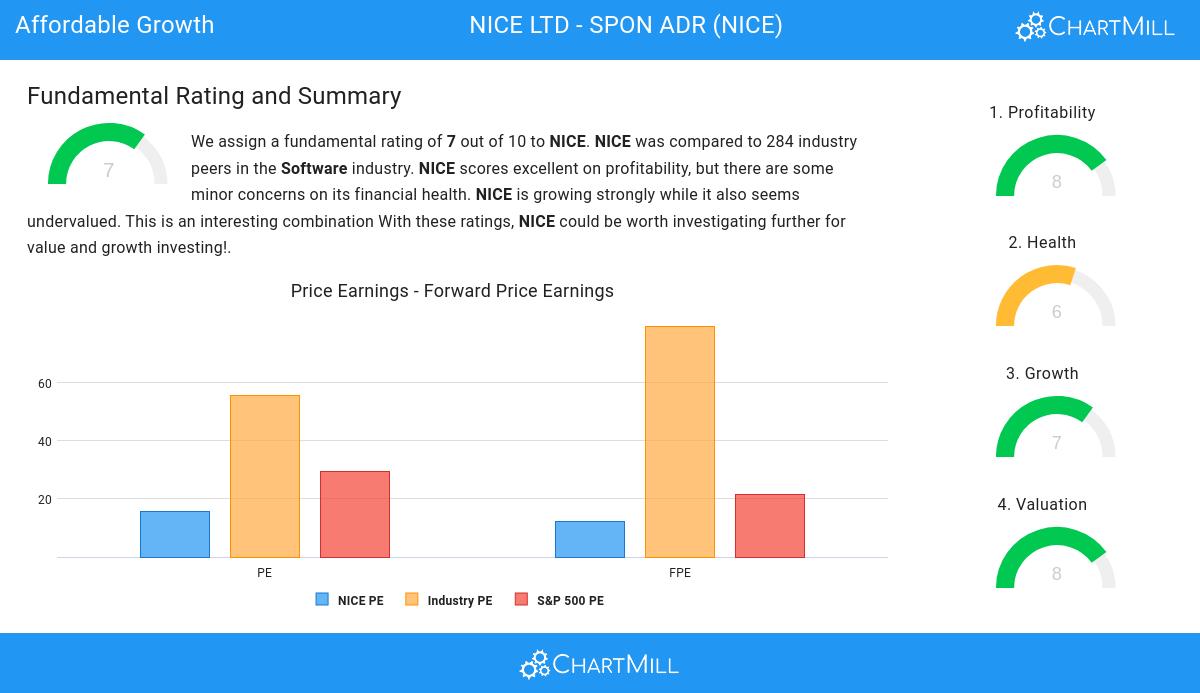
- NICE's Price/Earnings ratio is rather cheap when compared to the industry. NICE is cheaper than 85.16% of the companies in the same industry.
- The average S&P500 Price/Earnings ratio is at 29.65. NICE is valued slightly cheaper when compared to this.
- Based on the Price/Forward Earnings ratio, NICE is valued cheaply inside the industry as 87.28% of the companies are valued more expensively.
- Compared to an average S&P500 Price/Forward Earnings ratio of 21.38, NICE is valued a bit cheaper.
- NICE's Enterprise Value to EBITDA ratio is rather cheap when compared to the industry. NICE is cheaper than 89.05% of the companies in the same industry.
- NICE's Price/Free Cash Flow ratio is rather cheap when compared to the industry. NICE is cheaper than 86.93% of the companies in the same industry.
- The low PEG Ratio(NY), which compensates the Price/Earnings for growth, indicates a rather cheap valuation of the company.
- NICE has an outstanding profitability rating, which may justify a higher PE ratio.
- A more expensive valuation may be justified as NICE's earnings are expected to grow with 16.47% in the coming years.
Health Analysis for NASDAQ:NICE
To gauge a stock's financial health, ChartMill utilizes a Health Rating on a scale of 0 to 10. This comprehensive evaluation encompasses liquidity and solvency, both in absolute terms and in comparison to industry peers. NASDAQ:NICE has earned a 6 out of 10:
- NICE has a debt to FCF ratio of 0.72. This is a very positive value and a sign of high solvency as it would only need 0.72 years to pay back of all of its debts.
- NICE's Debt to FCF ratio of 0.72 is fine compared to the rest of the industry. NICE outperforms 75.27% of its industry peers.
- A Debt/Equity ratio of 0.13 indicates that NICE is not too dependend on debt financing.
- NICE has a Current Ratio of 2.45. This indicates that NICE is financially healthy and has no problem in meeting its short term obligations.
- With a decent Current ratio value of 2.45, NICE is doing good in the industry, outperforming 69.26% of the companies in the same industry.
- A Quick Ratio of 2.45 indicates that NICE has no problem at all paying its short term obligations.
- NICE has a Quick ratio of 2.45. This is in the better half of the industry: NICE outperforms 70.67% of its industry peers.
A Closer Look at Profitability for NASDAQ:NICE
Discover ChartMill's exclusive Profitability Rating, a proprietary metric that assesses stocks on a scale of 0 to 10. It takes into consideration various profitability ratios and margins, both in absolute terms and relative to industry peers. Notably, NASDAQ:NICE has achieved a 8:
- The Return On Assets of NICE (7.81%) is better than 84.45% of its industry peers.
- With an excellent Return On Equity value of 11.41%, NICE belongs to the best of the industry, outperforming 83.39% of the companies in the same industry.
- With an excellent Return On Invested Capital value of 9.18%, NICE belongs to the best of the industry, outperforming 86.22% of the companies in the same industry.
- The last Return On Invested Capital (9.18%) for NICE is above the 3 year average (7.04%), which is a sign of increasing profitability.
- Looking at the Profit Margin, with a value of 15.48%, NICE belongs to the top of the industry, outperforming 83.39% of the companies in the same industry.
- In the last couple of years the Profit Margin of NICE has grown nicely.
- With an excellent Operating Margin value of 19.64%, NICE belongs to the best of the industry, outperforming 89.40% of the companies in the same industry.
- NICE's Operating Margin has improved in the last couple of years.
Our Affordable Growth screener lists more Affordable Growth stocks and is updated daily.
Our latest full fundamental report of NICE contains the most current fundamental analsysis.
Disclaimer
This is not investing advice! The article highlights some of the observations at the time of writing, but you should always make your own analysis and invest based on your own insights.
