
NYSE:NE is a prime example of a stock that offers more than what meets the eye in terms of fundamentals.
By Mill Chart
Last update: Oct 9, 2024
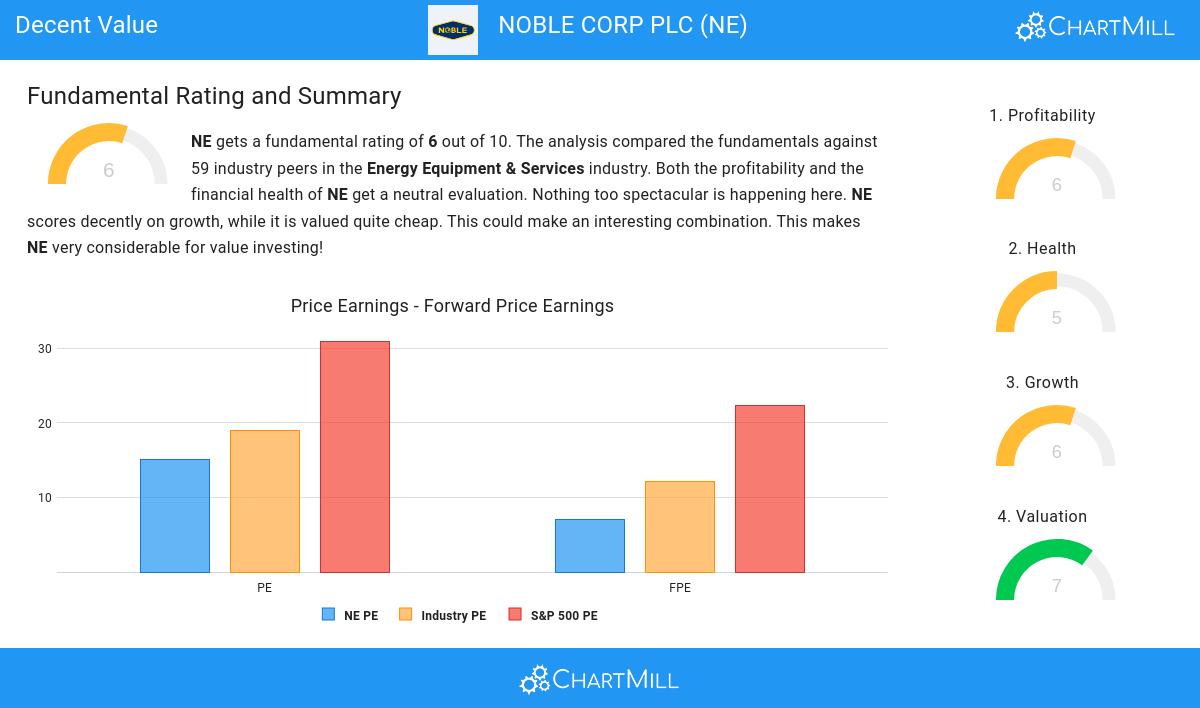
Our stock screening tool has identified NOBLE CORP PLC (NYSE:NE) as an undervalued gem with strong fundamentals. NYSE:NE boasts decent financial health and profitability while maintaining an attractive price point. We'll break it down further.
Valuation Examination for NYSE:NE
ChartMill assigns a proprietary Valuation Rating to each stock. The score is computed by evaluating various valuation aspects, like price to earnings and free cash flow, both absolutely as relative to the market and industry. NYSE:NE was assigned a score of 7 for valuation:
- Compared to the rest of the industry, the Price/Earnings ratio of NE indicates a somewhat cheap valuation: NE is cheaper than 71.19% of the companies listed in the same industry.
- The average S&P500 Price/Earnings ratio is at 30.97. NE is valued rather cheaply when compared to this.
- A Price/Forward Earnings ratio of 7.00 indicates a rather cheap valuation of NE.
- 88.14% of the companies in the same industry are more expensive than NE, based on the Price/Forward Earnings ratio.
- Compared to an average S&P500 Price/Forward Earnings ratio of 22.29, NE is valued rather cheaply.
- NE's low PEG Ratio(NY), which compensates the Price/Earnings for growth, indicates a rather cheap valuation of the company.
- The decent profitability rating of NE may justify a higher PE ratio.
- NE's earnings are expected to grow with 50.65% in the coming years. This may justify a more expensive valuation.
Analyzing Profitability Metrics
ChartMill's Profitability Rating offers a unique perspective on stock analysis, providing scores from 0 to 10. These ratings consider a wide range of profitability metrics and margins, both in comparison to industry peers and on their own merits. For NYSE:NE, the assigned 6 is a significant indicator of profitability:
- NE has a better Return On Assets (10.71%) than 86.44% of its industry peers.
- NE's Return On Equity of 15.02% is fine compared to the rest of the industry. NE outperforms 71.19% of its industry peers.
- The Return On Invested Capital of NE (12.26%) is better than 81.36% of its industry peers.
- With an excellent Profit Margin value of 22.41%, NE belongs to the best of the industry, outperforming 94.92% of the companies in the same industry.
- NE has a Operating Margin of 24.93%. This is amongst the best in the industry. NE outperforms 91.53% of its industry peers.
- The Gross Margin of NE (42.50%) is better than 84.75% of its industry peers.
A Closer Look at Health for NYSE:NE
ChartMill employs a unique Health Rating system for all stocks. This rating, ranging from 0 to 10, is determined by analyzing various liquidity and solvency ratios. For NYSE:NE, the assigned 5 for health provides valuable insights:
- An Altman-Z score of 3.40 indicates that NE is not in any danger for bankruptcy at the moment.
- The Altman-Z score of NE (3.40) is better than 79.66% of its industry peers.
- NE has a Debt/Equity ratio of 0.16. This is a healthy value indicating a solid balance between debt and equity.
- Looking at the Debt to Equity ratio, with a value of 0.16, NE is in the better half of the industry, outperforming 72.88% of the companies in the same industry.
Deciphering NYSE:NE's Growth Rating
ChartMill assigns a proprietary Growth Rating to each stock. The score is computed by evaluating various growth aspects, like EPS and revenue growth. We take into account the history as well as the estimated future numbers. NYSE:NE was assigned a score of 6 for growth:
- The Earnings Per Share has grown by an impressive 64.19% over the past year.
- NE shows a strong growth in Revenue. In the last year, the Revenue has grown by 22.66%.
- The Revenue has been growing by 19.05% on average over the past years. This is quite good.
- NE is expected to show a strong growth in Earnings Per Share. In the coming years, the EPS will grow by 50.65% yearly.
- The Revenue is expected to grow by 13.27% on average over the next years. This is quite good.
Our Decent Value screener lists more Decent Value stocks and is updated daily.
Our latest full fundamental report of NE contains the most current fundamental analsysis.
Keep in mind
Important Note: The content of this article is not intended as trading advice. It is essential to perform your own analysis and exercise caution when making trading decisions. The article presents observations created by automated analysis but does not guarantee any trading or investment outcomes. Always trade responsibly and make independent judgments.
