NASDAQ:NBIX is showing decent growth, but is still valued reasonably.
By Mill Chart
Last update: Feb 26, 2025
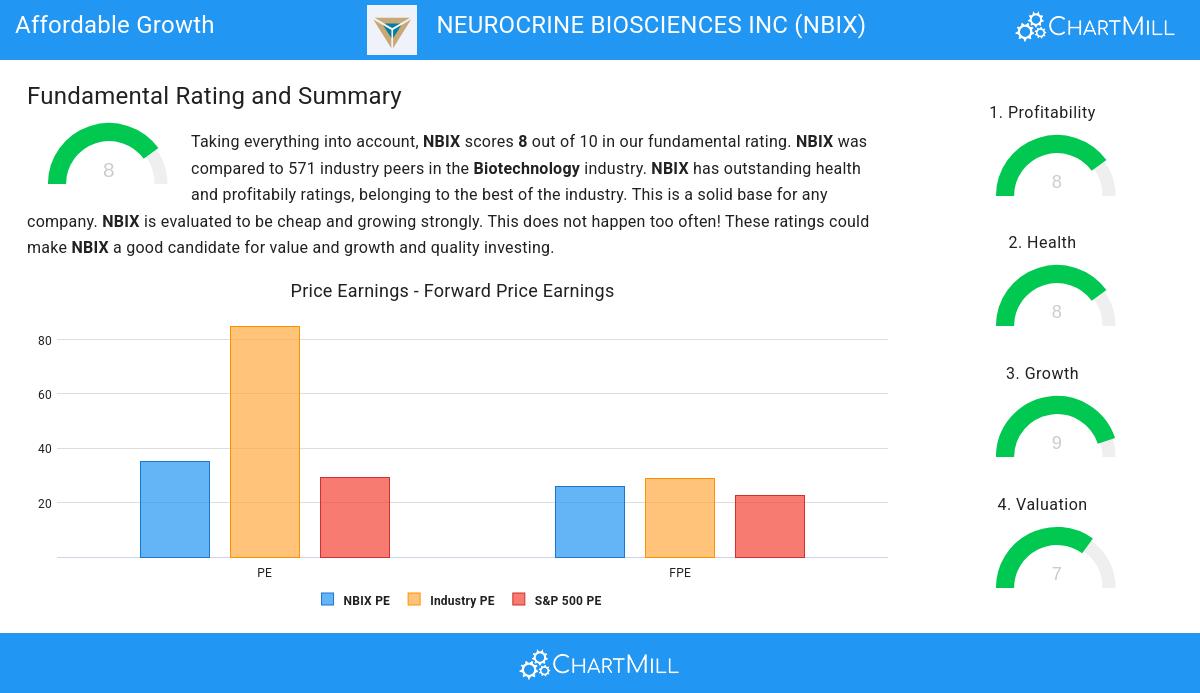
Our stock screener has singled out NEUROCRINE BIOSCIENCES INC (NASDAQ:NBIX) as an attractive growth opportunity. NASDAQ:NBIX is demonstrating remarkable growth potential while maintaining strong financial indicators, making it a reasonably priced option. We'll explore this further.
How do we evaluate the Growth for NASDAQ:NBIX?
To evaluate a stock's growth potential, ChartMill utilizes a Growth Rating on a scale of 0 to 10. This comprehensive assessment considers various growth aspects, including historical and estimated EPS and revenue growth. NASDAQ:NBIX has achieved a 9 out of 10:
- NBIX shows a strong growth in Earnings Per Share. In the last year, the EPS has been growing by 35.95%, which is quite impressive.
- NBIX shows a strong growth in Earnings Per Share. Measured over the last years, the EPS has been growing by 58.39% yearly.
- Looking at the last year, NBIX shows a very strong growth in Revenue. The Revenue has grown by 24.81%.
- Measured over the past years, NBIX shows a very strong growth in Revenue. The Revenue has been growing by 24.48% on average per year.
- NBIX is expected to show a strong growth in Earnings Per Share. In the coming years, the EPS will grow by 41.25% yearly.
- NBIX is expected to show quite a strong growth in Revenue. In the coming years, the Revenue will grow by 13.54% yearly.
A Closer Look at Valuation for NASDAQ:NBIX
An integral part of ChartMill's stock analysis is the Valuation Rating, which spans from 0 to 10. This rating evaluates diverse valuation factors, including price to earnings and cash flows, while considering the stock's profitability and growth. NASDAQ:NBIX has received a 7 out of 10:
- Compared to the rest of the industry, the Price/Earnings ratio of NBIX indicates a rather cheap valuation: NBIX is cheaper than 94.30% of the companies listed in the same industry.
- 93.05% of the companies in the same industry are more expensive than NBIX, based on the Price/Forward Earnings ratio.
- Based on the Enterprise Value to EBITDA ratio, NBIX is valued cheaper than 96.43% of the companies in the same industry.
- Based on the Price/Free Cash Flow ratio, NBIX is valued cheaper than 96.08% of the companies in the same industry.
- NBIX's low PEG Ratio(NY), which compensates the Price/Earnings for growth, indicates a rather cheap valuation of the company.
- The excellent profitability rating of NBIX may justify a higher PE ratio.
- A more expensive valuation may be justified as NBIX's earnings are expected to grow with 40.83% in the coming years.
Health Assessment of NASDAQ:NBIX
ChartMill employs a unique Health Rating system for all stocks. This rating, ranging from 0 to 10, is determined by analyzing various liquidity and solvency ratios. For NASDAQ:NBIX, the assigned 8 for health provides valuable insights:
- NBIX has an Altman-Z score of 7.70. This indicates that NBIX is financially healthy and has little risk of bankruptcy at the moment.
- The Altman-Z score of NBIX (7.70) is better than 84.85% of its industry peers.
- There is no outstanding debt for NBIX. This means it has a Debt/Equity and Debt/FCF ratio of 0 and it is amongst the best of the sector and industry.
- A Current Ratio of 3.40 indicates that NBIX has no problem at all paying its short term obligations.
- NBIX has a Quick Ratio of 3.28. This indicates that NBIX is financially healthy and has no problem in meeting its short term obligations.
Profitability Assessment of NASDAQ:NBIX
ChartMill utilizes a Profitability Rating to assess stocks, scoring them on a scale of 0 to 10. This rating takes into account a variety of profitability ratios and margins, both in absolute terms and in comparison to industry peers. NASDAQ:NBIX has earned a 8 out of 10:
- NBIX has a Return On Assets of 9.18%. This is amongst the best in the industry. NBIX outperforms 96.08% of its industry peers.
- NBIX has a Return On Equity of 13.18%. This is amongst the best in the industry. NBIX outperforms 96.08% of its industry peers.
- The Return On Invested Capital of NBIX (13.20%) is better than 96.43% of its industry peers.
- The 3 year average ROIC (11.40%) for NBIX is below the current ROIC(13.20%), indicating increased profibility in the last year.
- NBIX's Profit Margin of 14.49% is amongst the best of the industry. NBIX outperforms 96.26% of its industry peers.
- NBIX's Profit Margin has improved in the last couple of years.
- Looking at the Operating Margin, with a value of 24.75%, NBIX belongs to the top of the industry, outperforming 96.97% of the companies in the same industry.
- With an excellent Gross Margin value of 98.56%, NBIX belongs to the best of the industry, outperforming 98.04% of the companies in the same industry.
Our Affordable Growth screener lists more Affordable Growth stocks and is updated daily.
Check the latest full fundamental report of NBIX for a complete fundamental analysis.
Disclaimer
This is not investing advice! The article highlights some of the observations at the time of writing, but you should always make your own analysis and invest based on your own insights.
101.38
+1.28 (+1.28%)
Find more stocks in the Stock Screener
NBIX Latest News and Analysis
 6 days ago - ChartmillLooking for growth without the hefty price tag? Consider NEUROCRINE BIOSCIENCES INC (NASDAQ:NBIX).
Based on Fundamental Analysis it can be said that NASDAQ:NBIX is a growth stock which is not overvalued.
 9 days ago - ChartmillNEUROCRINE BIOSCIENCES INC (NASDAQ:NBIX) is an undervalued gem with solid fundamentals.
Discover NEUROCRINE BIOSCIENCES INC, an undervalued stock. NASDAQ:NBIX showcases solid financial health and profitability while maintaining an appealing valuation.
