NASDAQ:NBIX stands out as a growth opportunity that won't break the bank.
By Mill Chart
Last update: Oct 22, 2024
Discover NEUROCRINE BIOSCIENCES INC (NASDAQ:NBIX), an undervalued growth gem identified by our stock screener. NASDAQ:NBIX is shining in terms of growth metrics, and it's also displaying strong financial health and profitability. What's more, it retains an appealing valuation. We'll break it down further.
How do we evaluate the Growth for NASDAQ:NBIX?
A key component of ChartMill's stock assessment is the Growth Rating, which spans from 0 to 10. This rating evaluates diverse growth factors, such as EPS and revenue growth, considering both past performance and future projections. NASDAQ:NBIX has received a 9 out of 10:
- NBIX shows a strong growth in Earnings Per Share. In the last year, the EPS has been growing by 91.33%, which is quite impressive.
- Measured over the past years, NBIX shows a very strong growth in Earnings Per Share. The EPS has been growing by 70.09% on average per year.
- Looking at the last year, NBIX shows a very strong growth in Revenue. The Revenue has grown by 26.69%.
- The Revenue has been growing by 33.13% on average over the past years. This is a very strong growth!
- The Earnings Per Share is expected to grow by 44.72% on average over the next years. This is a very strong growth
- NBIX is expected to show quite a strong growth in Revenue. In the coming years, the Revenue will grow by 15.24% yearly.
ChartMill's Evaluation of Valuation
To assess a stock's valuation, ChartMill utilizes a Valuation Rating on a scale of 0 to 10. This comprehensive assessment considers various valuation aspects, comparing price to earnings and cash flows, while factoring in profitability and growth. NASDAQ:NBIX has achieved a 8 out of 10:
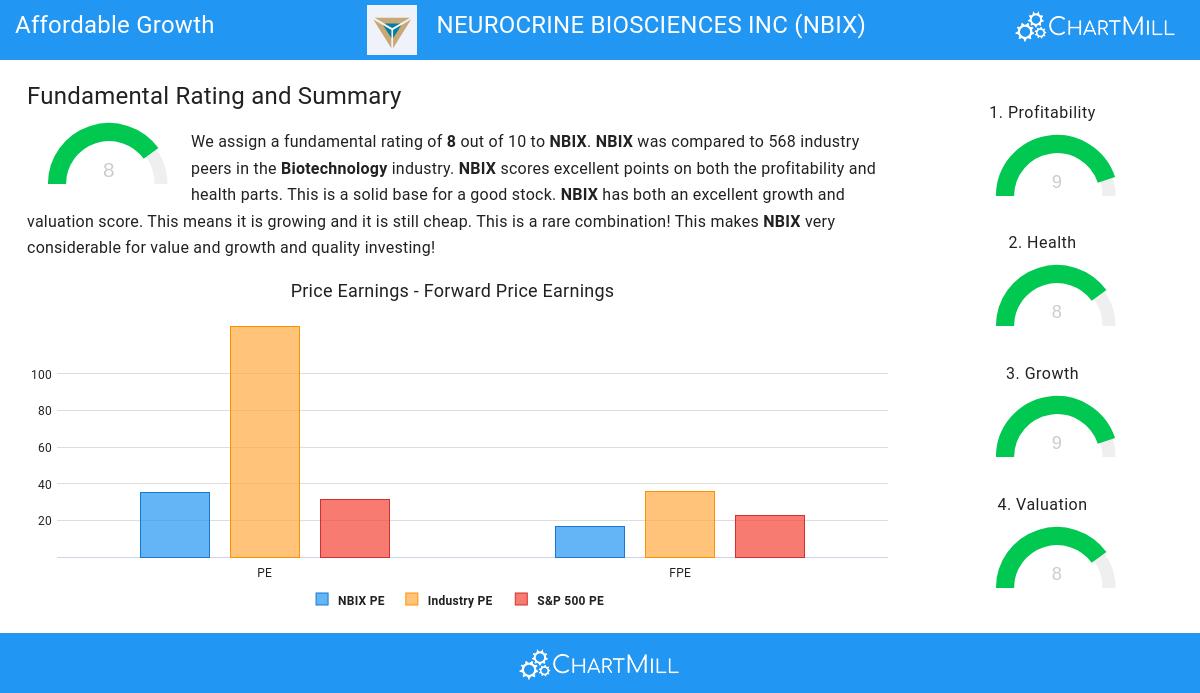
- 95.38% of the companies in the same industry are more expensive than NBIX, based on the Price/Earnings ratio.
- 96.27% of the companies in the same industry are more expensive than NBIX, based on the Price/Forward Earnings ratio.
- NBIX is valuated rather cheaply when we compare the Price/Forward Earnings ratio to 22.63, which is the current average of the S&P500 Index.
- Based on the Enterprise Value to EBITDA ratio, NBIX is valued cheaper than 95.91% of the companies in the same industry.
- Based on the Price/Free Cash Flow ratio, NBIX is valued cheaply inside the industry as 96.63% of the companies are valued more expensively.
- The low PEG Ratio(NY), which compensates the Price/Earnings for growth, indicates a rather cheap valuation of the company.
- NBIX has an outstanding profitability rating, which may justify a higher PE ratio.
- A more expensive valuation may be justified as NBIX's earnings are expected to grow with 57.66% in the coming years.
Understanding NASDAQ:NBIX's Health Score
ChartMill employs its own Health Rating for stock assessment. This rating, ranging from 0 to 10, is calculated by examining various liquidity and solvency ratios. In the case of NASDAQ:NBIX, the assigned 8 reflects its health status:
- An Altman-Z score of 10.50 indicates that NBIX is not in any danger for bankruptcy at the moment.
- Looking at the Altman-Z score, with a value of 10.50, NBIX belongs to the top of the industry, outperforming 85.97% of the companies in the same industry.
- There is no outstanding debt for NBIX. This means it has a Debt/Equity and Debt/FCF ratio of 0 and it is amongst the best of the sector and industry.
- A Current Ratio of 4.19 indicates that NBIX has no problem at all paying its short term obligations.
- NBIX has a Quick Ratio of 4.08. This indicates that NBIX is financially healthy and has no problem in meeting its short term obligations.
How do we evaluate the Profitability for NASDAQ:NBIX?
ChartMill assigns a proprietary Profitability Rating to each stock. The score is computed by evaluating various profitability ratios and margins and ranges from 0 to 10. NASDAQ:NBIX was assigned a score of 9 for profitability:
- NBIX has a better Return On Assets (10.26%) than 96.63% of its industry peers.
- NBIX's Return On Equity of 13.52% is amongst the best of the industry. NBIX outperforms 96.09% of its industry peers.
- NBIX has a Return On Invested Capital of 13.81%. This is amongst the best in the industry. NBIX outperforms 96.80% of its industry peers.
- The last Return On Invested Capital (13.81%) for NBIX is above the 3 year average (9.89%), which is a sign of increasing profitability.
- With an excellent Profit Margin value of 16.00%, NBIX belongs to the best of the industry, outperforming 96.63% of the companies in the same industry.
- NBIX's Profit Margin has improved in the last couple of years.
- NBIX has a Operating Margin of 25.70%. This is amongst the best in the industry. NBIX outperforms 97.69% of its industry peers.
- In the last couple of years the Operating Margin of NBIX has grown nicely.
- Looking at the Gross Margin, with a value of 98.28%, NBIX belongs to the top of the industry, outperforming 97.69% of the companies in the same industry.
More Affordable Growth stocks can be found in our Affordable Growth screener.
For an up to date full fundamental analysis you can check the fundamental report of NBIX
Disclaimer
Important Note: The content of this article is not intended as trading advice. It is essential to perform your own analysis and exercise caution when making trading decisions. The article presents observations created by automated analysis but does not guarantee any trading or investment outcomes. Always trade responsibly and make independent judgments.
100.1
+3.94 (+4.1%)
Find more stocks in the Stock Screener
NBIX Latest News and Analysis
 5 days ago - ChartmillLooking for growth without the hefty price tag? Consider NEUROCRINE BIOSCIENCES INC (NASDAQ:NBIX).
Based on Fundamental Analysis it can be said that NASDAQ:NBIX is a growth stock which is not overvalued.
 8 days ago - ChartmillNEUROCRINE BIOSCIENCES INC (NASDAQ:NBIX) is an undervalued gem with solid fundamentals.
Discover NEUROCRINE BIOSCIENCES INC, an undervalued stock. NASDAQ:NBIX showcases solid financial health and profitability while maintaining an appealing valuation.
 21 days ago - ChartmillNEUROCRINE BIOSCIENCES INC (NASDAQ:NBIX)—A High-Growth Stock Gearing Up for Its Next Upward Move.
Based on a technical and fundamental analysis of NASDAQ:NBIX we can say: NEUROCRINE BIOSCIENCES INC (NASDAQ:NBIX)—Positioned as a High-Growth Stock, Ready for a Potential Breakout.
