
Why MUELLER WATER PRODUCTS INC-A (NYSE:MWA) qualifies as a high growth stock.
By Mill Chart
Last update: Mar 25, 2025
MUELLER WATER PRODUCTS INC-A (NYSE:MWA) has been identified as a Technical Breakout Setup Pattern by our stock screener. This pattern typically occurs when a stock takes a pause after a significant rise, indicating the possibility of a continuation in the trend. While it's impossible to predict with certainty, it might be beneficial to monitor NYSE:MWA.
Deciphering the Technical Picture of MWA
Every day ChartMill assigns a Technical Rating to every stock. The score ranges from 0 to 10 and is determined by evaluating multiple technical indicators and properties.
We assign a technical rating of 10 out of 10 to MWA. This is due to a consistent performance in both the short and longer term time frames. Also compared to the overall market, MWA is showing a nice and steady performance.
- Both the short term and long term trends are positive. This is a very positive sign.
- Looking at the yearly performance, MWA did better than 95% of all other stocks. We also observe that the gains produced by MWA over the past year are nicely spread over this period.
- MWA is part of the Machinery industry. There are 126 other stocks in this industry. MWA outperforms 97% of them.
- MWA is currently trading near its 52 week high. This is a good sign, certainly because the S&P500 Index is not trading near new highs.
- In the last month MWA has a been trading in the 24.24 - 28.58 range, which is quite wide. It is currently trading near the high of this range.
- Volume is considerably higher in the last couple of days.
Our latest full technical report of MWA contains the most current technical analsysis.
How does the Setup look for MWA
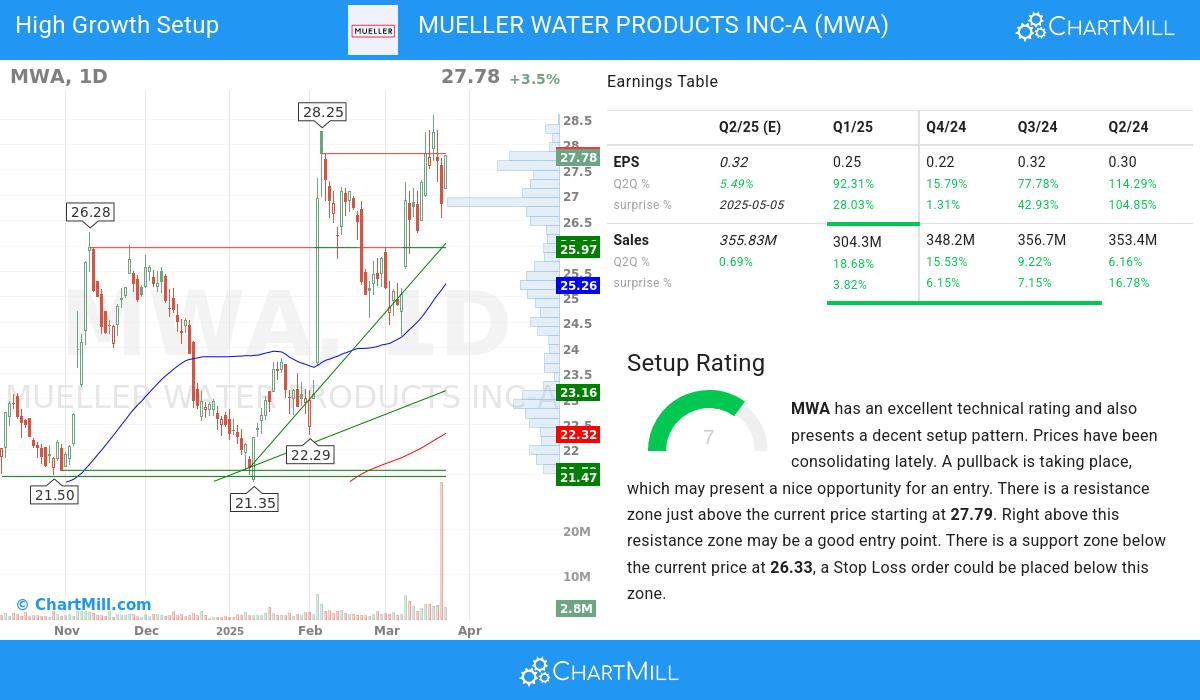
ChartMill also assign a Setup Rating to every stock. With this score it is determined to what extend the stock has been trading in a range in the recent days and weeks. This score also ranges from 0 to 10 and is updated daily. The setup score evaluates various short term technical indicators. MWA scores a 7 out of 10:
MWA has an excellent technical rating and also presents a decent setup pattern. Prices have been consolidating lately. A pullback is taking place, which may present a nice opportunity for an entry. There is a resistance zone just above the current price starting at 27.79. Right above this resistance zone may be a good entry point. There is a support zone below the current price at 26.33, a Stop Loss order could be placed below this zone.
Exploring MWA's Growth
Every stock receives a High Growth Momentum Rating (HGM) from ChartMill, ranging from 0 to 10. This rating assesses various growth and profitability aspects, including historical and projected EPS and revenue growth. MWA boasts a 6 out of 10:
Earnings Momentum
- MWA has demonstrated consistent growth in its earnings per share (EPS) from one quarter to another (Q2Q), with a 92.31% increase. This indicates improving financial performance and the company's effective management of its operations.
- Accelerating EPS growth for MWA: the current Q2Q growth of 92.31% exceeds the previous quarter Q2Q growth of 15.79%.
- Over the past year, MWA has demonstrated 70.31% growth in EPS, signifying its positive financial trajectory and potential for future profitability.
- The q2q revenue growth of 18.68% of MWA highlights the company's ability to generate incremental revenue and suggests positive market demand for its products or services.
- Accelerating Sales growth for MWA: the current Q2Q growth of 18.68% exceeds the previous quarter Q2Q growth of 15.53%.
- Sales growth accelerated for 3 quarters in a row.
- With a track record of beating EPS estimates in the last 4 quarters, MWA showcases its consistent ability to deliver earnings surprises. This reflects the company's strong execution and its competitive position in the market.
Financial Strength & Profitability
- MWA has experienced notable growth in its operating margin over the past year, reflecting improved operational performance. This growth suggests the company's ability to generate higher profits from its core business activities.
- In the past year MWA has expanded its Profit Margin, which demonstrates increasing profitability.
- MWA has experienced notable growth in its free cash flow (FCF) over the past year, signaling improved cash generation and strong financial performance. This growth suggests the company's ability to generate excess cash for reinvestment or shareholder returns.
- MWA has a healthy Return on Equity(ROE) of 16.41%. This demonstrates the company's efficient utilization of capital and indicates its commitment to driving profitability.
- MWA's Debt/Equity ratio of 0.54 suggests a healthy balance between debt financing and shareholder equity.
Strong Market Performance
- The Relative Strength (RS) of MWA has consistently been strong, with a current 95.8 rating. This indicates the stock's ability to exhibit relative price outperformance and reflects its competitive strength.
Our High Growth Momentum Breakout screen will find you more ideas suited for high growth momentum breakouts.
Disclaimer
This article should in no way be interpreted as advice. The article is based on the observed metrics at the time of writing, but you should always make your own analysis and trade or invest at your own responsibility.
