Uncovering Dividend Opportunities with NYSE:MSM.
By Mill Chart
Last update: Oct 14, 2024
Unearth the potential of MSC INDUSTRIAL DIRECT CO-A (NYSE:MSM) as a dividend stock recommended by our stock screening tool. NYSE:MSM maintains a robust financial footing and delivers a sustainable dividend. We'll delve into the details below.
How We Gauge Dividend for NYSE:MSM
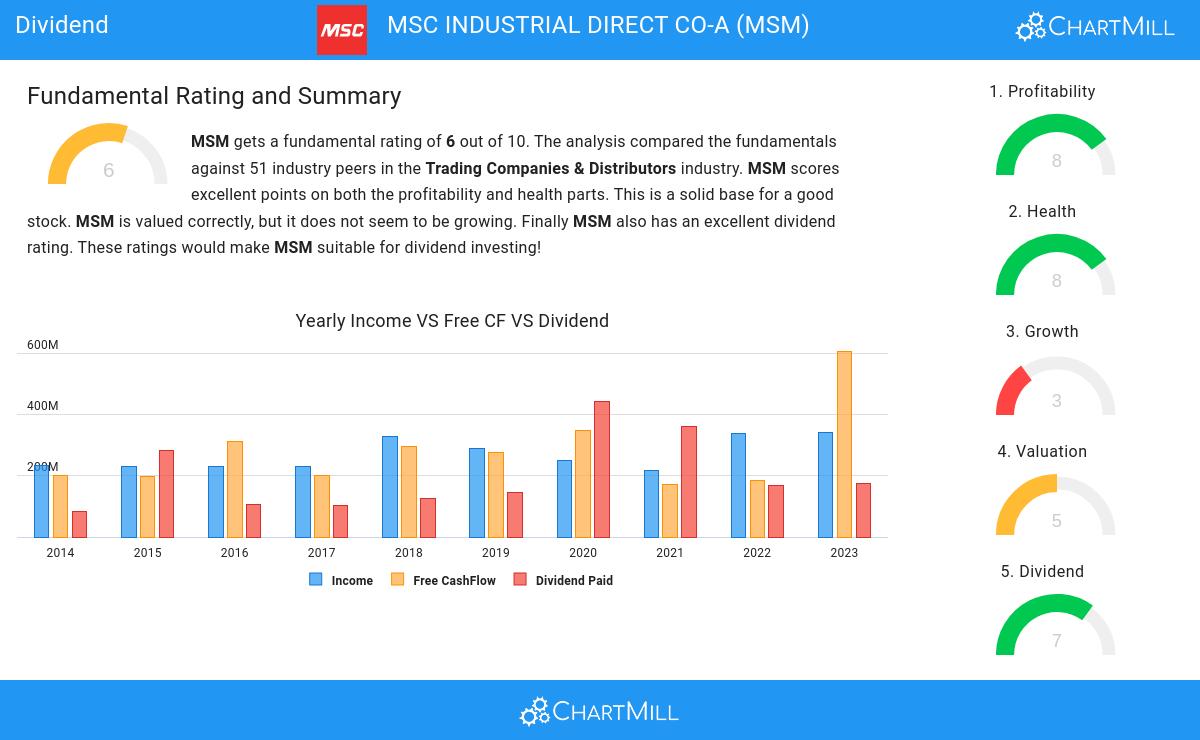
ChartMill provides a Dividend Rating for every stock, ranging from 0 to 10. This rating assesses various dividend aspects, including yield, growth, and sustainability. NYSE:MSM earns a 7 out of 10:
- With a Yearly Dividend Yield of 4.08%, MSM is a good candidate for dividend investing.
- MSM's Dividend Yield is rather good when compared to the industry average which is at 1.79. MSM pays more dividend than 96.08% of the companies in the same industry.
- Compared to an average S&P500 Dividend Yield of 2.22, MSM pays a better dividend.
- On average, the dividend of MSM grows each year by 7.27%, which is quite nice.
- MSM has been paying a dividend for at least 10 years, so it has a reliable track record.
Understanding NYSE:MSM's Health Score
ChartMill employs its own Health Rating for stock assessment. This rating, ranging from 0 to 10, is calculated by examining various liquidity and solvency ratios. In the case of NYSE:MSM, the assigned 8 reflects its health status:
- An Altman-Z score of 5.36 indicates that MSM is not in any danger for bankruptcy at the moment.
- The Altman-Z score of MSM (5.36) is better than 82.35% of its industry peers.
- MSM has a debt to FCF ratio of 1.51. This is a very positive value and a sign of high solvency as it would only need 1.51 years to pay back of all of its debts.
- Looking at the Debt to FCF ratio, with a value of 1.51, MSM is in the better half of the industry, outperforming 74.51% of the companies in the same industry.
- MSM has a Debt/Equity ratio of 0.21. This is a healthy value indicating a solid balance between debt and equity.
- MSM has a Debt to Equity ratio of 0.21. This is in the better half of the industry: MSM outperforms 64.71% of its industry peers.
- A Current Ratio of 2.08 indicates that MSM has no problem at all paying its short term obligations.
- The current and quick ratio evaluation for MSM is rather negative, while it does have excellent solvency and profitability. These ratios do not necessarly indicate liquidity issues and need to be evaluated against the specifics of the business.
Exploring NYSE:MSM's Profitability
ChartMill utilizes a Profitability Rating to assess stocks, scoring them on a scale of 0 to 10. This rating takes into account a variety of profitability ratios and margins, both in absolute terms and in comparison to industry peers. NYSE:MSM has earned a 8 out of 10:
- With an excellent Return On Assets value of 11.77%, MSM belongs to the best of the industry, outperforming 86.27% of the companies in the same industry.
- Looking at the Return On Equity, with a value of 20.73%, MSM is in the better half of the industry, outperforming 72.55% of the companies in the same industry.
- MSM has a Return On Invested Capital of 17.26%. This is amongst the best in the industry. MSM outperforms 92.16% of its industry peers.
- MSM had an Average Return On Invested Capital over the past 3 years of 16.95%. This is significantly above the industry average of 10.25%.
- The 3 year average ROIC (16.95%) for MSM is below the current ROIC(17.26%), indicating increased profibility in the last year.
- MSM has a better Profit Margin (7.44%) than 64.71% of its industry peers.
- With a decent Operating Margin value of 11.06%, MSM is doing good in the industry, outperforming 66.67% of the companies in the same industry.
- MSM has a Gross Margin of 41.03%. This is in the better half of the industry: MSM outperforms 70.59% of its industry peers.
Our Best Dividend screener lists more Best Dividend stocks and is updated daily.
For an up to date full fundamental analysis you can check the fundamental report of MSM
Keep in mind
This article should in no way be interpreted as advice. The article is based on the observed metrics at the time of writing, but you should always make your own analysis and trade or invest at your own responsibility.
NYSE:MSM (4/17/2025, 9:52:30 AM)
76.27
+0.43 (+0.57%)
Find more stocks in the Stock Screener
MSM Latest News and Analysis
 9 days ago - ChartmillWhy MSC INDUSTRIAL DIRECT CO-A (NYSE:MSM) is a Top Pick for Dividend Investors.
Why MSC INDUSTRIAL DIRECT CO-A (NYSE:MSM) provides a good dividend, while having solid fundamentals.
