
Discover MSC INDUSTRIAL DIRECT CO-A (NYSE:MSM)—a stock that our stock screener has recognized as a solid dividend pick with strong fundamentals. NYSE:MSM showcases decent financial health and profitability while providing a sustainable dividend. We'll explore the specifics further.
ChartMill's Evaluation of Dividend
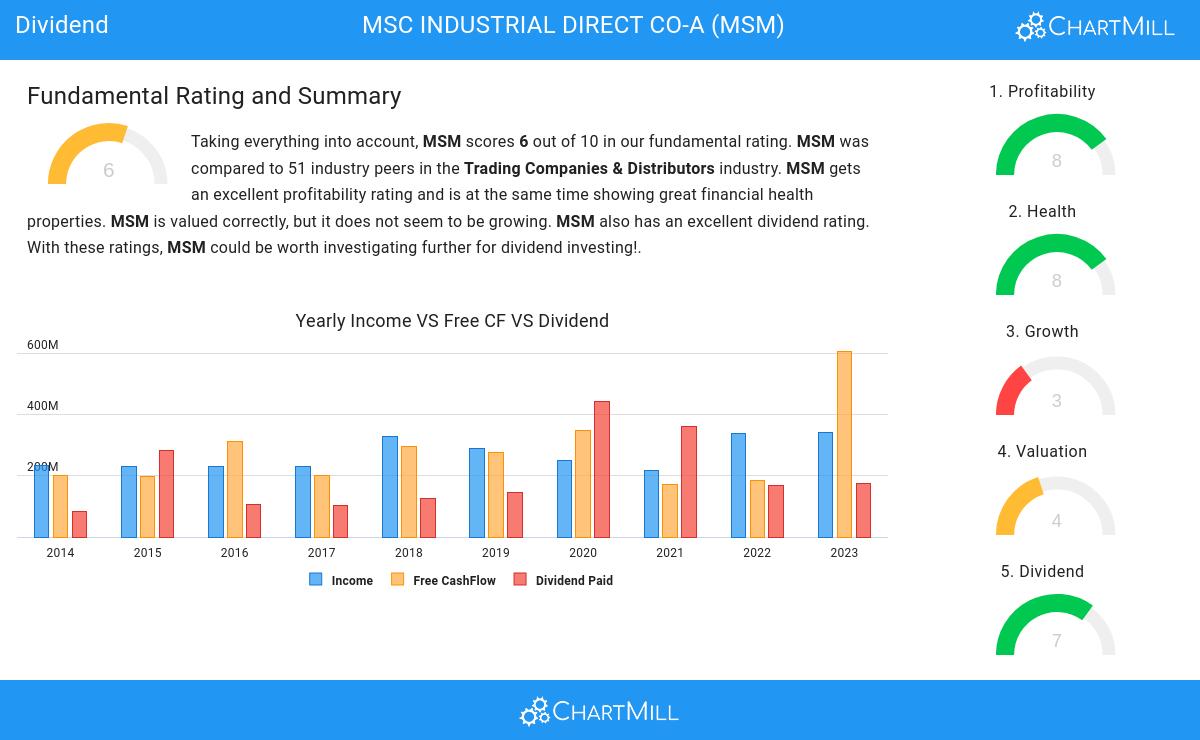
ChartMill employs its own Dividend Rating system for all stocks. This score, on a scale of 0 to 10, is determined by evaluating different dividend factors, such as yield, historical performance, dividend growth, and sustainability. NYSE:MSM has been assigned a 7 for dividend:
- MSM has a Yearly Dividend Yield of 4.07%, which is a nice return.
- Compared to an average industry Dividend Yield of 1.83, MSM pays a better dividend. On top of this MSM pays more dividend than 96.08% of the companies listed in the same industry.
- MSM's Dividend Yield is rather good when compared to the S&P500 average which is at 2.24.
- The dividend of MSM is nicely growing with an annual growth rate of 7.27%!
- MSM has been paying a dividend for at least 10 years, so it has a reliable track record.
A Closer Look at Health for NYSE:MSM
ChartMill utilizes a Health Rating to assess stocks, scoring them on a scale of 0 to 10. This rating takes into account a variety of liquidity and solvency ratios, both in absolute terms and in comparison to industry peers. NYSE:MSM has earned a 8 out of 10:
- An Altman-Z score of 5.33 indicates that MSM is not in any danger for bankruptcy at the moment.
- With an excellent Altman-Z score value of 5.33, MSM belongs to the best of the industry, outperforming 82.35% of the companies in the same industry.
- MSM has a debt to FCF ratio of 1.51. This is a very positive value and a sign of high solvency as it would only need 1.51 years to pay back of all of its debts.
- With a decent Debt to FCF ratio value of 1.51, MSM is doing good in the industry, outperforming 76.47% of the companies in the same industry.
- A Debt/Equity ratio of 0.21 indicates that MSM is not too dependend on debt financing.
- MSM's Debt to Equity ratio of 0.21 is fine compared to the rest of the industry. MSM outperforms 64.71% of its industry peers.
- MSM has a Current Ratio of 2.08. This indicates that MSM is financially healthy and has no problem in meeting its short term obligations.
- The current and quick ratio evaluation for MSM is rather negative, while it does have excellent solvency and profitability. These ratios do not necessarly indicate liquidity issues and need to be evaluated against the specifics of the business.
Exploring NYSE:MSM's Profitability
Discover ChartMill's exclusive Profitability Rating, a proprietary metric that assesses stocks on a scale of 0 to 10. It takes into consideration various profitability ratios and margins, both in absolute terms and relative to industry peers. Notably, NYSE:MSM has achieved a 8:
- The Return On Assets of MSM (11.77%) is better than 86.27% of its industry peers.
- With a decent Return On Equity value of 20.73%, MSM is doing good in the industry, outperforming 72.55% of the companies in the same industry.
- Looking at the Return On Invested Capital, with a value of 17.26%, MSM belongs to the top of the industry, outperforming 90.20% of the companies in the same industry.
- The Average Return On Invested Capital over the past 3 years for MSM is significantly above the industry average of 10.37%.
- The 3 year average ROIC (16.95%) for MSM is below the current ROIC(17.26%), indicating increased profibility in the last year.
- The Profit Margin of MSM (7.44%) is better than 64.71% of its industry peers.
- MSM's Operating Margin of 11.06% is fine compared to the rest of the industry. MSM outperforms 66.67% of its industry peers.
- With a decent Gross Margin value of 41.03%, MSM is doing good in the industry, outperforming 70.59% of the companies in the same industry.
Every day, new Best Dividend stocks can be found on ChartMill in our Best Dividend screener.
For an up to date full fundamental analysis you can check the fundamental report of MSM
Disclaimer
This is not investing advice! The article highlights some of the observations at the time of writing, but you should always make your own analysis and invest based on your own insights.