Exploring NASDAQ:MSFT's dividend characteristics.
By Mill Chart
Last update: Oct 24, 2024
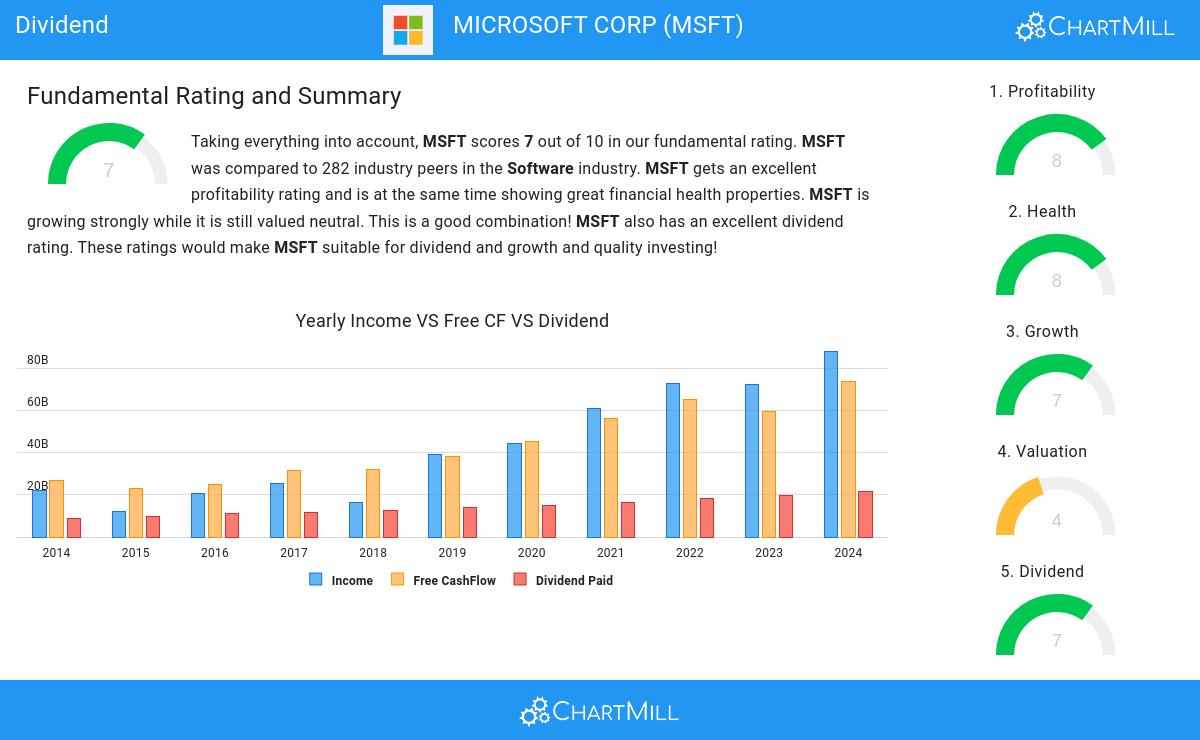
Our stock screener has singled out MICROSOFT CORP (NASDAQ:MSFT) as a promising choice for dividend investors. NASDAQ:MSFT not only scores well in profitability, solvency, and liquidity but also offers a decent dividend. We'll explore this further.
Dividend Assessment of NASDAQ:MSFT
ChartMill assigns a proprietary Dividend Rating to each stock. The score is computed by evaluating various valuation aspects, like the yield, the history, the dividend growth and sustainability. NASDAQ:MSFT was assigned a score of 7 for dividend:
- MSFT's Dividend Yield is rather good when compared to the industry average which is at 10.91. MSFT pays more dividend than 92.86% of the companies in the same industry.
- On average, the dividend of MSFT grows each year by 10.19%, which is quite nice.
- MSFT has been paying a dividend for at least 10 years, so it has a reliable track record.
- MSFT has not decreased its dividend for at least 10 years, so it has a reliable track record of non decreasing dividend.
- 24.70% of the earnings are spent on dividend by MSFT. This is a low number and sustainable payout ratio.
- The dividend of MSFT is growing, but earnings are growing more, so the dividend growth is sustainable.
Health Assessment of NASDAQ:MSFT
ChartMill employs its own Health Rating for stock assessment. This rating, ranging from 0 to 10, is calculated by examining various liquidity and solvency ratios. In the case of NASDAQ:MSFT, the assigned 8 reflects its health status:
- An Altman-Z score of 9.51 indicates that MSFT is not in any danger for bankruptcy at the moment.
- MSFT has a Altman-Z score of 9.51. This is amongst the best in the industry. MSFT outperforms 82.14% of its industry peers.
- MSFT has a debt to FCF ratio of 1.06. This is a very positive value and a sign of high solvency as it would only need 1.06 years to pay back of all of its debts.
- MSFT has a better Debt to FCF ratio (1.06) than 73.93% of its industry peers.
- MSFT has a Debt/Equity ratio of 0.28. This is a healthy value indicating a solid balance between debt and equity.
- Even though the debt/equity ratio score it not favorable for MSFT, it has very limited outstanding debt, so we won't put too much weight on the DE evaluation.
- MSFT does not score too well on the current and quick ratio evaluation. However, as it has excellent solvency and profitability, these ratios do not necessarly indicate liquidity issues and need to be evaluated against the specifics of the business.
Profitability Insights: NASDAQ:MSFT
Discover ChartMill's exclusive Profitability Rating, a proprietary metric that assesses stocks on a scale of 0 to 10. It takes into consideration various profitability ratios and margins, both in absolute terms and relative to industry peers. Notably, NASDAQ:MSFT has achieved a 8:
- MSFT's Return On Assets of 17.21% is amongst the best of the industry. MSFT outperforms 94.64% of its industry peers.
- With an excellent Return On Equity value of 32.83%, MSFT belongs to the best of the industry, outperforming 92.86% of the companies in the same industry.
- The Return On Invested Capital of MSFT (22.63%) is better than 96.43% of its industry peers.
- The Average Return On Invested Capital over the past 3 years for MSFT is significantly above the industry average of 10.40%.
- MSFT has a better Profit Margin (35.96%) than 95.71% of its industry peers.
- In the last couple of years the Profit Margin of MSFT has grown nicely.
- The Operating Margin of MSFT (44.64%) is better than 100.00% of its industry peers.
- MSFT's Operating Margin has improved in the last couple of years.
More Best Dividend stocks can be found in our Best Dividend screener.
Our latest full fundamental report of MSFT contains the most current fundamental analsysis.
Keep in mind
This article should in no way be interpreted as advice. The article is based on the observed metrics at the time of writing, but you should always make your own analysis and trade or invest at your own responsibility.
395.26
+1.22 (+0.31%)
Find more stocks in the Stock Screener
MSFT Latest News and Analysis
 2 hours ago - ChartmillStay updated with the S&P500 stocks that are on the move in today's after-hours session.
The regular session of the US market on Wednesday is now over, but let's get a preview of the after-hours session and explore the top S&P500 gainers and losers driving the post-market movements.
 2 days ago - ChartmillMarket Monitor April 29 ( IBM UP, Nvidia DOWN)
Wall Street Holds Steady Ahead of Major Earnings and Economic Data
 8 days ago - ChartmillMarket Monitor April 23 ( Tesla, Apple, 3M UP, RTX, Northrop Grumman DOWN)
Wall Street Rebounds Sharply on Trade Optimism and AI Buzz, Despite Tesla’s Struggles
 11 days ago - ChartmillWhy MICROSOFT CORP (NASDAQ:MSFT) provides a good dividend, while having solid fundamentals.
Is MICROSOFT CORP (NASDAQ:MSFT) suited for dividend investing?
 19 days ago - ChartmillWhy MICROSOFT CORP (NASDAQ:MSFT) qualifies as a quality stock.
A fundamental analysis of (NASDAQ:MSFT): Is NASDAQ:MSFT a Suitable Choice for Quality Investing?
