
NYSE:MRK: good value for what you're paying.
By Mill Chart
Last update: Sep 18, 2024
MERCK & CO. INC. (NYSE:MRK) is a hidden gem identified by our stock screening tool, featuring undervaluation and robust fundamentals. NYSE:MRK showcases decent financial health and profitability, coupled with an attractive price. Let's dig deeper into the analysis.
Valuation Assessment of NYSE:MRK
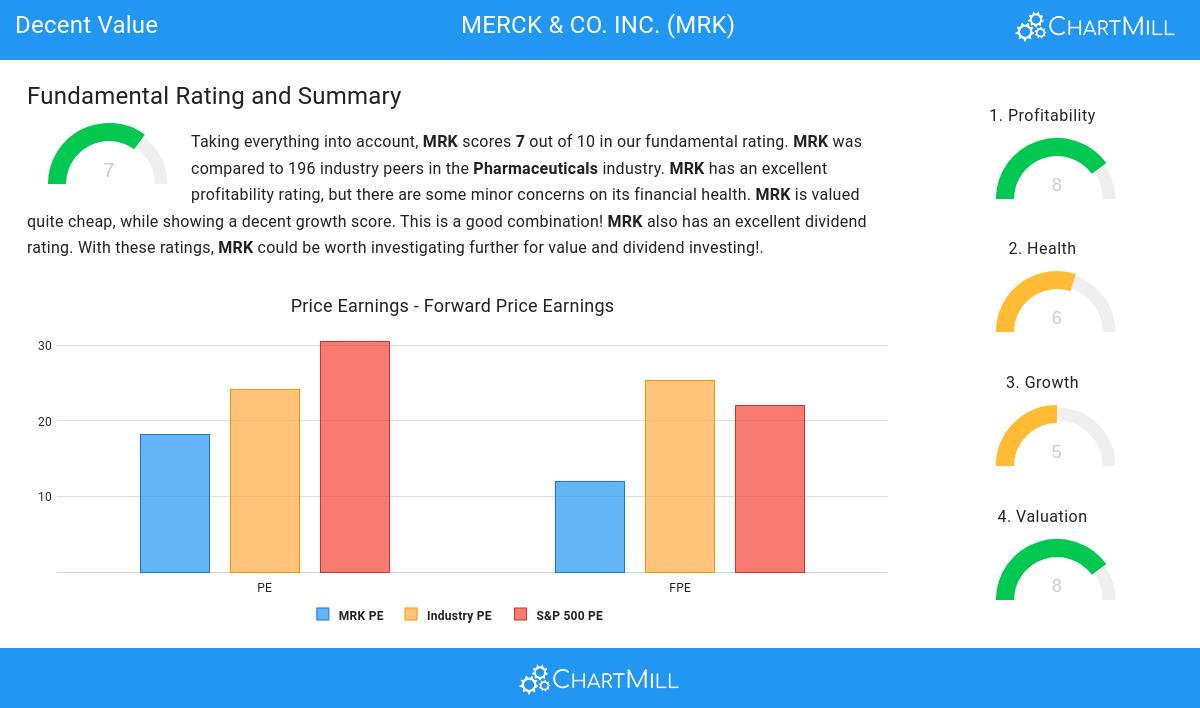
ChartMill employs its own Valuation Rating system for all stocks. This score, ranging from 0 to 10, is determined by evaluating different valuation factors, including price to earnings and free cash flow, both in absolute terms and relative to the market and industry. NYSE:MRK has earned a 8 for valuation:
- Based on the Price/Earnings ratio, MRK is valued cheaper than 87.69% of the companies in the same industry.
- When comparing the Price/Earnings ratio of MRK to the average of the S&P500 Index (30.57), we can say MRK is valued slightly cheaper.
- MRK's Price/Forward Earnings ratio is rather cheap when compared to the industry. MRK is cheaper than 85.64% of the companies in the same industry.
- Compared to an average S&P500 Price/Forward Earnings ratio of 22.04, MRK is valued a bit cheaper.
- 81.54% of the companies in the same industry are more expensive than MRK, based on the Enterprise Value to EBITDA ratio.
- Based on the Price/Free Cash Flow ratio, MRK is valued cheaply inside the industry as 84.62% of the companies are valued more expensively.
- MRK's low PEG Ratio(NY), which compensates the Price/Earnings for growth, indicates a rather cheap valuation of the company.
- The excellent profitability rating of MRK may justify a higher PE ratio.
- A more expensive valuation may be justified as MRK's earnings are expected to grow with 93.31% in the coming years.
Profitability Examination for NYSE:MRK
ChartMill's Profitability Rating offers a unique perspective on stock analysis, providing scores from 0 to 10. These ratings consider a wide range of profitability metrics and margins, both in comparison to industry peers and on their own merits. For NYSE:MRK, the assigned 8 is a significant indicator of profitability:
- The Return On Assets of MRK (12.20%) is better than 94.87% of its industry peers.
- MRK has a better Return On Equity (31.52%) than 94.87% of its industry peers.
- MRK has a Return On Invested Capital of 16.35%. This is amongst the best in the industry. MRK outperforms 93.33% of its industry peers.
- The last Return On Invested Capital (16.35%) for MRK is above the 3 year average (12.63%), which is a sign of increasing profitability.
- MRK's Profit Margin of 21.98% is amongst the best of the industry. MRK outperforms 93.33% of its industry peers.
- MRK's Operating Margin of 28.68% is amongst the best of the industry. MRK outperforms 93.85% of its industry peers.
- With an excellent Gross Margin value of 75.79%, MRK belongs to the best of the industry, outperforming 82.56% of the companies in the same industry.
Analyzing Health Metrics
To gauge a stock's financial health, ChartMill utilizes a Health Rating on a scale of 0 to 10. This comprehensive evaluation encompasses liquidity and solvency, both in absolute terms and in comparison to industry peers. NYSE:MRK has earned a 6 out of 10:
- An Altman-Z score of 4.56 indicates that MRK is not in any danger for bankruptcy at the moment.
- MRK has a better Altman-Z score (4.56) than 79.49% of its industry peers.
- MRK has a debt to FCF ratio of 2.87. This is a good value and a sign of high solvency as MRK would need 2.87 years to pay back of all of its debts.
- MRK's Debt to FCF ratio of 2.87 is amongst the best of the industry. MRK outperforms 91.79% of its industry peers.
What does the Growth looks like for NYSE:MRK
ChartMill assigns a Growth Rating to each stock, ranging from 0 to 10. This rating is determined by analyzing different growth elements, including EPS and revenue growth, spanning both historical and future figures. In the case of NYSE:MRK, the assigned 5 reflects its growth potential:
- MRK shows a strong growth in Earnings Per Share. In the last year, the EPS has been growing by 131.67%, which is quite impressive.
- The Earnings Per Share is expected to grow by 53.11% on average over the next years. This is a very strong growth
- When comparing the EPS growth rate of the last years to the growth rate of the upcoming years, we see that the growth is accelerating.
More Decent Value stocks can be found in our Decent Value screener.
For an up to date full fundamental analysis you can check the fundamental report of MRK
Keep in mind
This is not investing advice! The article highlights some of the observations at the time of writing, but you should always make your own analysis and invest based on your own insights.
99.18
+0.91 (+0.93%)
Find more stocks in the Stock Screener
MRK Latest News and Analysis


