
Investors seeking growth at a reasonable cost should explore NYSE:MNSO.
By Mill Chart
Last update: Oct 7, 2024
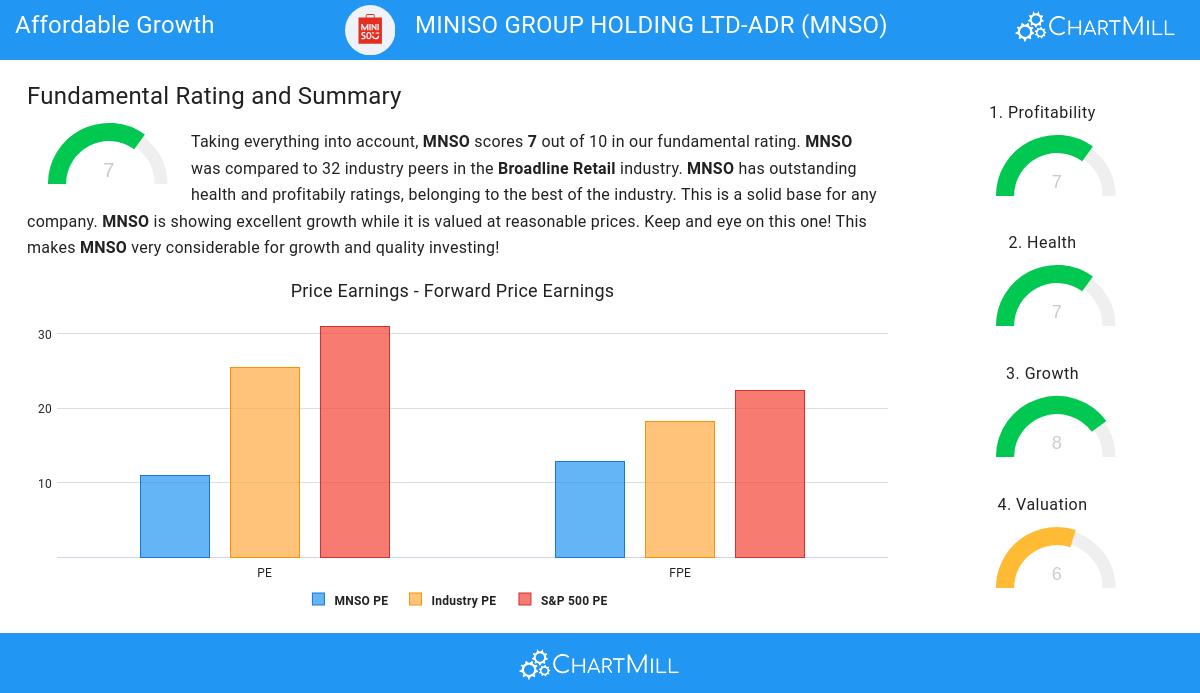
Consider MINISO GROUP HOLDING LTD-ADR (NYSE:MNSO) as an affordable growth stock, identified by our stock screening tool. NYSE:MNSO is showcasing impressive growth figures and is well-positioned in terms of profitability, solvency, and liquidity. Moreover, it seems to be priced reasonably. Let's dive deeper into the analysis.
Assessing Growth Metrics for NYSE:MNSO
ChartMill assigns a Growth Rating to each stock, ranging from 0 to 10. This rating is determined by analyzing different growth elements, including EPS and revenue growth, spanning both historical and future figures. In the case of NYSE:MNSO, the assigned 8 reflects its growth potential:
- The Earnings Per Share has grown by an impressive 179.13% over the past year.
- MNSO shows a strong growth in Revenue. In the last year, the Revenue has grown by 22.67%.
- MNSO shows quite a strong growth in Revenue. Measured over the last years, the Revenue has been growing by 8.51% yearly.
- MNSO is expected to show a strong growth in Earnings Per Share. In the coming years, the EPS will grow by 32.67% yearly.
- Based on estimates for the next years, MNSO will show a very strong growth in Revenue. The Revenue will grow by 29.00% on average per year.
- When comparing the Revenue growth rate of the last years to the growth rate of the upcoming years, we see that the growth is accelerating.
Assessing Valuation for NYSE:MNSO
To assess a stock's valuation, ChartMill utilizes a Valuation Rating on a scale of 0 to 10. This comprehensive assessment considers various valuation aspects, comparing price to earnings and cash flows, while factoring in profitability and growth. NYSE:MNSO has achieved a 6 out of 10:
- Based on the Price/Earnings ratio of 10.91, the valuation of MNSO can be described as reasonable.
- Based on the Price/Earnings ratio, MNSO is valued a bit cheaper than the industry average as 75.00% of the companies are valued more expensively.
- Compared to an average S&P500 Price/Earnings ratio of 31.01, MNSO is valued rather cheaply.
- MNSO's Price/Forward Earnings ratio is a bit cheaper when compared to the industry. MNSO is cheaper than 62.50% of the companies in the same industry.
- The average S&P500 Price/Forward Earnings ratio is at 22.36. MNSO is valued slightly cheaper when compared to this.
- The low PEG Ratio(NY), which compensates the Price/Earnings for growth, indicates a rather cheap valuation of the company.
- The decent profitability rating of MNSO may justify a higher PE ratio.
- A more expensive valuation may be justified as MNSO's earnings are expected to grow with 32.67% in the coming years.
A Closer Look at Health for NYSE:MNSO
ChartMill assigns a proprietary Health Rating to each stock. The score is computed by evaluating various liquidity and solvency ratios and ranges from 0 to 10. NYSE:MNSO was assigned a score of 7 for health:
- An Altman-Z score of 6.98 indicates that MNSO is not in any danger for bankruptcy at the moment.
- Looking at the Altman-Z score, with a value of 6.98, MNSO belongs to the top of the industry, outperforming 87.50% of the companies in the same industry.
- MNSO has a Debt/Equity ratio of 0.15. This is a healthy value indicating a solid balance between debt and equity.
- With a decent Debt to Equity ratio value of 0.15, MNSO is doing good in the industry, outperforming 68.75% of the companies in the same industry.
- MNSO has a Current Ratio of 2.38. This indicates that MNSO is financially healthy and has no problem in meeting its short term obligations.
- MNSO has a better Current ratio (2.38) than 81.25% of its industry peers.
- MNSO has a better Quick ratio (1.93) than 78.13% of its industry peers.
Profitability Insights: NYSE:MNSO
ChartMill employs its own Profitability Rating system for stock evaluation. This score, ranging from 0 to 10, is derived from an analysis of diverse profitability metrics and margins. In the case of NYSE:MNSO, the assigned 7 is noteworthy for profitability:
- With an excellent Return On Assets value of 15.39%, MNSO belongs to the best of the industry, outperforming 93.75% of the companies in the same industry.
- Looking at the Return On Equity, with a value of 24.94%, MNSO is in the better half of the industry, outperforming 78.13% of the companies in the same industry.
- With an excellent Return On Invested Capital value of 19.84%, MNSO belongs to the best of the industry, outperforming 93.75% of the companies in the same industry.
- The 3 year average ROIC (9.40%) for MNSO is below the current ROIC(19.84%), indicating increased profibility in the last year.
- With an excellent Profit Margin value of 15.71%, MNSO belongs to the best of the industry, outperforming 93.75% of the companies in the same industry.
- MNSO has a better Operating Margin (19.87%) than 93.75% of its industry peers.
- MNSO's Operating Margin has improved in the last couple of years.
- In the last couple of years the Gross Margin of MNSO has grown nicely.
Every day, new Affordable Growth stocks can be found on ChartMill in our Affordable Growth screener.
Our latest full fundamental report of MNSO contains the most current fundamental analsysis.
Disclaimer
Important Note: The content of this article is not intended as trading advice. It is essential to perform your own analysis and exercise caution when making trading decisions. The article presents observations created by automated analysis but does not guarantee any trading or investment outcomes. Always trade responsibly and make independent judgments.
NYSE:MNSO (4/16/2025, 10:17:54 AM)
15.44
-1.14 (-6.88%)
Find more stocks in the Stock Screener
