
NASDAQ:META: a strong growth stock preparing for the next leg up?.
By Mill Chart
Last update: Jan 22, 2025
For growth-minded investors, high revenue and EPS growth are key criteria. Today, we'll examine whether META PLATFORMS INC-CLASS A (NASDAQ:META) fits the bill for growth investing, particularly as it forms a base and hints at a potential breakout. Remember, due diligence is essential, but META PLATFORMS INC-CLASS A has caught our attention on our screen for growth with base formation. It may warrant additional investigation.
Analyzing Growth Metrics
ChartMill assigns a Growth Rating to every stock. This score ranges from 0 to 10 and evaluates the different growth aspects like EPS and Revenue, both in the past as in the future. NASDAQ:META scores a 8 out of 10:
- The Earnings Per Share has grown by an impressive 87.38% over the past year.
- The Earnings Per Share has been growing by 14.50% on average over the past years. This is quite good.
- The Revenue has grown by 23.06% in the past year. This is a very strong growth!
- The Revenue has been growing by 19.29% on average over the past years. This is quite good.
- META is expected to show quite a strong growth in Earnings Per Share. In the coming years, the EPS will grow by 19.08% yearly.
- META is expected to show quite a strong growth in Revenue. In the coming years, the Revenue will grow by 13.62% yearly.
- When comparing the EPS growth rate of the last years to the growth rate of the upcoming years, we see that the growth is accelerating.
Health Analysis for NASDAQ:META
To gauge a stock's financial health, ChartMill utilizes a Health Rating on a scale of 0 to 10. This comprehensive evaluation encompasses liquidity and solvency, both in absolute terms and in comparison to industry peers. NASDAQ:META has earned a 8 out of 10:
- An Altman-Z score of 12.33 indicates that META is not in any danger for bankruptcy at the moment.
- The Altman-Z score of META (12.33) is better than 89.55% of its industry peers.
- The Debt to FCF ratio of META is 0.55, which is an excellent value as it means it would take META, only 0.55 years of fcf income to pay off all of its debts.
- With a decent Debt to FCF ratio value of 0.55, META is doing good in the industry, outperforming 77.61% of the companies in the same industry.
- META has a Debt/Equity ratio of 0.18. This is a healthy value indicating a solid balance between debt and equity.
- A Current Ratio of 2.73 indicates that META has no problem at all paying its short term obligations.
- META's Current ratio of 2.73 is fine compared to the rest of the industry. META outperforms 67.16% of its industry peers.
- META has a Quick Ratio of 2.73. This indicates that META is financially healthy and has no problem in meeting its short term obligations.
- With a decent Quick ratio value of 2.73, META is doing good in the industry, outperforming 67.16% of the companies in the same industry.
What does the Profitability looks like for NASDAQ:META
ChartMill's Profitability Rating offers a unique perspective on stock analysis, providing scores from 0 to 10. These ratings consider a wide range of profitability metrics and margins, both in comparison to industry peers and on their own merits. For NASDAQ:META, the assigned 8 is a significant indicator of profitability:
- META's Return On Assets of 21.66% is amongst the best of the industry. META outperforms 95.52% of its industry peers.
- With an excellent Return On Equity value of 33.76%, META belongs to the best of the industry, outperforming 100.00% of the companies in the same industry.
- The Return On Invested Capital of META (23.67%) is better than 94.03% of its industry peers.
- Measured over the past 3 years, the Average Return On Invested Capital for META is significantly above the industry average of 12.59%.
- The last Return On Invested Capital (23.67%) for META is above the 3 year average (21.73%), which is a sign of increasing profitability.
- META has a better Profit Margin (35.55%) than 97.01% of its industry peers.
- META has a better Operating Margin (40.87%) than 100.00% of its industry peers.
- META has a Gross Margin of 81.50%. This is in the better half of the industry: META outperforms 74.63% of its industry peers.
Looking at the Setup
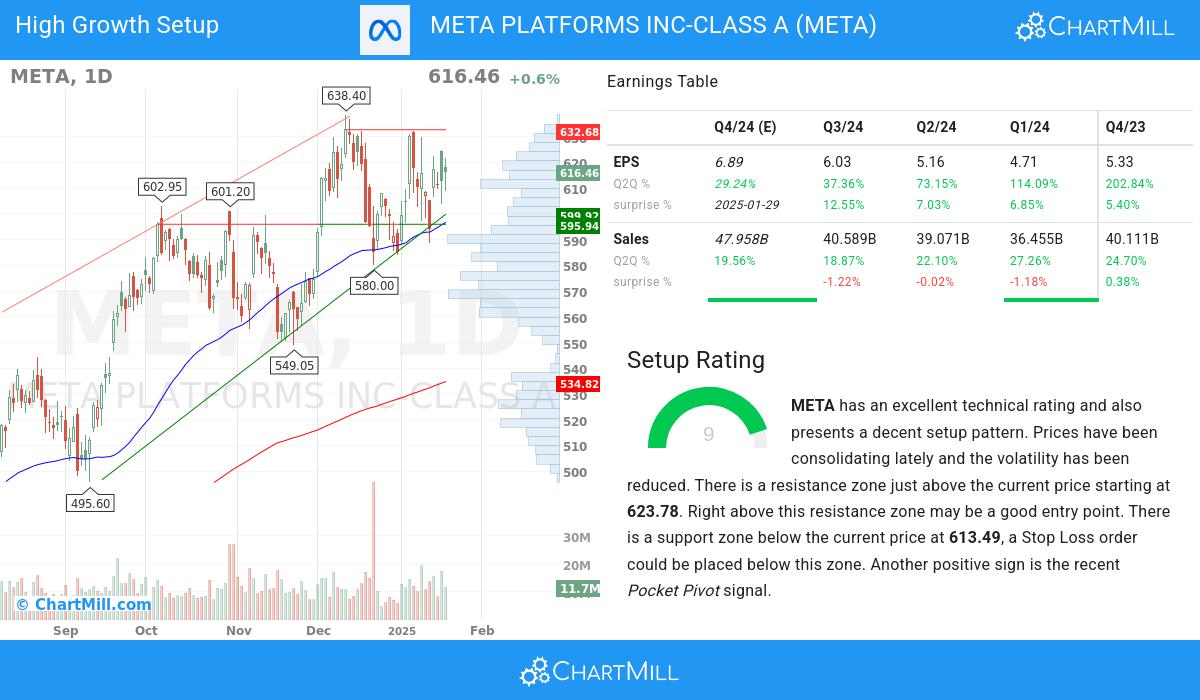
In addition to the Technical Rating, ChartMill provides a Setup Rating for each stock. This rating, ranging from 0 to 10, assesses the extent of consolidation in the stock based on multiple short-term technical indicators. Currently, NASDAQ:META has a 9 as its setup rating:
META has an excellent technical rating and also presents a decent setup pattern. We see reduced volatility while prices have been consolidating in the most recent period. There is a resistance zone just above the current price starting at 623.78. Right above this resistance zone may be a good entry point. There is a support zone below the current price at 613.49, a Stop Loss order could be placed below this zone. Very recently a Pocket Pivot signal was observed. This is another positive sign.
Our Strong Growth screener lists more Strong Growth stocks and is updated daily.
For an up to date full fundamental analysis you can check the fundamental report of META
For an up to date full technical analysis you can check the technical report of META
Keep in mind
This is not investing advice! The article highlights some of the observations at the time of writing, but you should always make your own analysis and invest based on your own insights.