
NASDAQ:META stands out as a growth opportunity that won't break the bank.
By Mill Chart
Last update: Oct 14, 2024
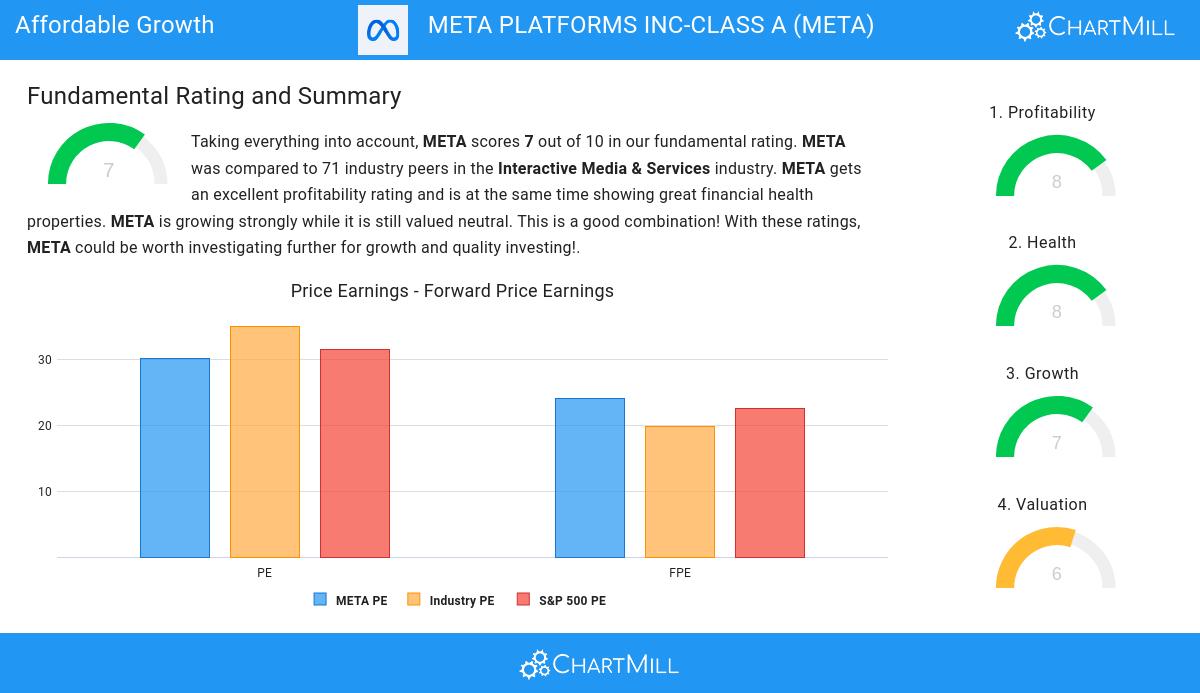
Our stock screener has singled out META PLATFORMS INC-CLASS A (NASDAQ:META) as an attractive growth opportunity. NASDAQ:META is demonstrating remarkable growth potential while maintaining strong financial indicators, making it a reasonably priced option. We'll explore this further.
Assessing Growth Metrics for NASDAQ:META
ChartMill assigns a proprietary Growth Rating to each stock. The score is computed by evaluating various growth aspects, like EPS and revenue growth. We take into account the history as well as the estimated future numbers. NASDAQ:META was assigned a score of 7 for growth:
- The Earnings Per Share has grown by an impressive 128.32% over the past year.
- META shows quite a strong growth in Earnings Per Share. Measured over the last years, the EPS has been growing by 14.50% yearly.
- META shows a strong growth in Revenue. In the last year, the Revenue has grown by 24.28%.
- The Revenue has been growing by 19.29% on average over the past years. This is quite good.
- Based on estimates for the next years, META will show a quite strong growth in Earnings Per Share. The EPS will grow by 16.58% on average per year.
- Based on estimates for the next years, META will show a quite strong growth in Revenue. The Revenue will grow by 12.27% on average per year.
Valuation Analysis for NASDAQ:META
ChartMill employs its own Valuation Rating system for all stocks. This score, ranging from 0 to 10, is determined by evaluating different valuation factors, including price to earnings and free cash flow, both in absolute terms and relative to the market and industry. NASDAQ:META has earned a 6 for valuation:
- Compared to the rest of the industry, the Price/Earnings ratio of META indicates a somewhat cheap valuation: META is cheaper than 64.29% of the companies listed in the same industry.
- Based on the Price/Forward Earnings ratio, META is valued a bit cheaper than the industry average as 61.43% of the companies are valued more expensively.
- 64.29% of the companies in the same industry are more expensive than META, based on the Enterprise Value to EBITDA ratio.
- META's Price/Free Cash Flow ratio is a bit cheaper when compared to the industry. META is cheaper than 68.57% of the companies in the same industry.
- The low PEG Ratio(NY), which compensates the Price/Earnings for growth, indicates a rather cheap valuation of the company.
- The excellent profitability rating of META may justify a higher PE ratio.
- META's earnings are expected to grow with 23.58% in the coming years. This may justify a more expensive valuation.
Assessing Health for NASDAQ:META
ChartMill employs a unique Health Rating system for all stocks. This rating, ranging from 0 to 10, is determined by analyzing various liquidity and solvency ratios. For NASDAQ:META, the assigned 8 for health provides valuable insights:
- An Altman-Z score of 14.46 indicates that META is not in any danger for bankruptcy at the moment.
- The Altman-Z score of META (14.46) is better than 94.29% of its industry peers.
- The Debt to FCF ratio of META is 0.37, which is an excellent value as it means it would take META, only 0.37 years of fcf income to pay off all of its debts.
- The Debt to FCF ratio of META (0.37) is better than 80.00% of its industry peers.
- A Debt/Equity ratio of 0.12 indicates that META is not too dependend on debt financing.
- Although META does not score too well on debt/equity it has very limited outstanding debt, which is well covered by the FCF. We will not put too much weight on the debt/equity number as it may be because of low equity, which could be a consequence of a share buyback program for instance. This needs to be investigated.
- A Current Ratio of 2.83 indicates that META has no problem at all paying its short term obligations.
- Looking at the Current ratio, with a value of 2.83, META is in the better half of the industry, outperforming 62.86% of the companies in the same industry.
- A Quick Ratio of 2.83 indicates that META has no problem at all paying its short term obligations.
- With a decent Quick ratio value of 2.83, META is doing good in the industry, outperforming 62.86% of the companies in the same industry.
A Closer Look at Profitability for NASDAQ:META
ChartMill's Profitability Rating offers a unique perspective on stock analysis, providing scores from 0 to 10. These ratings consider a wide range of profitability metrics and margins, both in comparison to industry peers and on their own merits. For NASDAQ:META, the assigned 8 is a significant indicator of profitability:
- META has a better Return On Assets (22.34%) than 98.57% of its industry peers.
- Looking at the Return On Equity, with a value of 32.81%, META belongs to the top of the industry, outperforming 97.14% of the companies in the same industry.
- The Return On Invested Capital of META (24.67%) is better than 95.71% of its industry peers.
- The Average Return On Invested Capital over the past 3 years for META is significantly above the industry average of 10.42%.
- The 3 year average ROIC (21.73%) for META is below the current ROIC(24.67%), indicating increased profibility in the last year.
- META has a better Profit Margin (34.34%) than 97.14% of its industry peers.
- Looking at the Operating Margin, with a value of 40.47%, META belongs to the top of the industry, outperforming 100.00% of the companies in the same industry.
- META has a Gross Margin of 81.49%. This is in the better half of the industry: META outperforms 74.29% of its industry peers.
More Affordable Growth stocks can be found in our Affordable Growth screener.
For an up to date full fundamental analysis you can check the fundamental report of META
Keep in mind
Important Note: The content of this article is not intended as trading advice. It is essential to perform your own analysis and exercise caution when making trading decisions. The article presents observations created by automated analysis but does not guarantee any trading or investment outcomes. Always trade responsibly and make independent judgments.