
MEDTRONIC PLC (NYSE:MDT) is setting up nicely for a breakout.
By Mill Chart
Last update: Feb 27, 2025
Our stock screener has detected a potential breakout setup on MEDTRONIC PLC (NYSE:MDT). This breakout pattern is observed when a stock consolidates following a strong upward movement. It's important to note that this pattern is based on technical analysis, and the actual breakout outcome is uncertain. However, it might be worth keeping an eye on NYSE:MDT.
Zooming in on the technicals.
Every day, ChartMill assigns a Technical Rating to each stock, providing a score ranging from 0 to 10. This rating is determined by evaluating various technical indicators and properties.
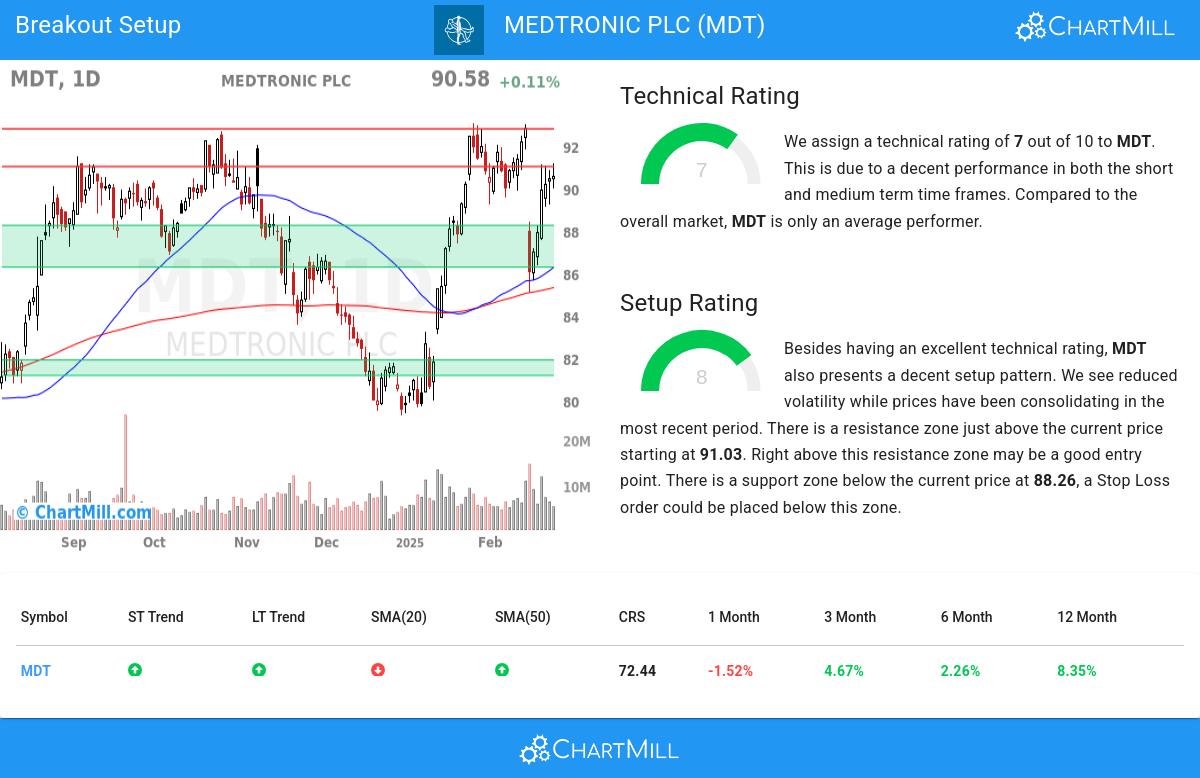
We assign a technical rating of 7 out of 10 to MDT. This is due to a decent performance in both the short and medium term time frames. Compared to the overall market, MDT is only an average performer.
- Both the short term and long term trends are positive. This is a very positive sign.
- MDT is currently trading in the upper part of its 52 week range. The S&P500 Index is also trading in the upper part of its 52 week range, so MDT is performing more or less in line with the market.
- In the last month MDT has a been trading in the 85.06 - 93.05 range, which is quite wide. It is currently trading in the middle of this range where prices have been consolidating recently, this may present a good entry opportunity, but some resistance may be present above.
- When comparing the yearly performance of all stocks, we notice that MDT is one of the better performing stocks in the market, outperforming 72% of all stocks. However, this overall performance is mostly based on the strong move around 7 months ago.
- MDT is an average performer in the Health Care Equipment & Supplies industry, it outperforms 69% of 189 stocks in the same industry.
Our latest full technical report of MDT contains the most current technical analsysis.
Why is NYSE:MDT a setup?
ChartMill incorporates a Setup Rating in its analysis, which measures the extent of consolidation in a stock over recent days and weeks. This rating, ranging from 0 to 10, is updated daily and takes into account multiple short-term technical indicators. The current setup rating for NYSE:MDT is 8:
Besides having an excellent technical rating, MDT also presents a decent setup pattern. We see reduced volatility while prices have been consolidating in the most recent period. There is a resistance zone just above the current price starting at 91.03. Right above this resistance zone may be a good entry point. There is a support zone below the current price at 88.26, a Stop Loss order could be placed below this zone.
How to trade NYSE:MDT?
A breakout opportunity may arise when the stock surpasses the current consolidation zone and reaches new highs. Traders often wait for this breakout before considering buying the stock. To manage risk, a stop loss order could be placed below the consolidation zone to limit potential losses.
This article should in no way be interpreted as trading advice. You should always make your own analysis and trade or not trade based on your own observations and style. The article is based purely on some technical observations.
Our Breakout screener lists more breakout setups and is updated daily.
Disclaimer
Important Note: The content of this article is not intended as trading advice. It is essential to perform your own analysis and exercise caution when making trading decisions. The article presents observations created by automated analysis but does not guarantee any trading or investment outcomes. Always trade responsibly and make independent judgments.
NYSE:MDT (4/24/2025, 1:44:03 PM)
84.07
+0.32 (+0.38%)
Find more stocks in the Stock Screener
MDT Latest News and Analysis
 15 days ago - ChartmillIs MEDTRONIC PLC (NYSE:MDT) a Good Fit for Dividend Investing?
Analyzing MEDTRONIC PLC (NYSE:MDT)'s Dividend Potential.
